EUR/USD Signal Update
Last Thursday’s signals were perfectly constructed to take advantage of the violent fall in price that occurred on Thursday, as the resistance at 1.3955 was sharply rejected. If you had followed the strict interpretation of the signal you would not have taken the trade, but a slightly more flexible interpretation taking the break of the bearish engulfing bar on the H1 chart could have netted more than 100 pips or 5 units of risk. If you did take this trade and have any part of the position still open, I would close it. The analysis worked out very well overall.
Today’s EUR/USD Signals
Risk 0.50%.
Any entry has to be taken between 8am and 5pm London time today.
Long Trade
Enter long following a next bar break of any bullish pin or engulfing hourly candle forming after the first touch of 1.3825. From two hours following the close of the first hourly candle that closes below 1.3825, this trade is invalidated.
Place the stop loss 1 pip above the local swing high.
Adjust the stop loss to break even when the price is 20 pips in profit. Remove 75% of the position as profit at 1.3890, and leave the remaining 25% to run.
Short Trade
Enter short following a next bar break of any bearish pin or engulfing hourly candle forming after the first touch of 1.3975. From two hours following the close of the first hourly candle that closes above 1.3975, this trade is invalidated.
Place the stop loss 1 pip above the local swing high.
Adjust the stop loss to break even when the price reaches 1.3925. Remove 50% of the position as profit at this point, another 25% at 1.3860, and leave the remaining 25% to run.
EUR/USD Analysis
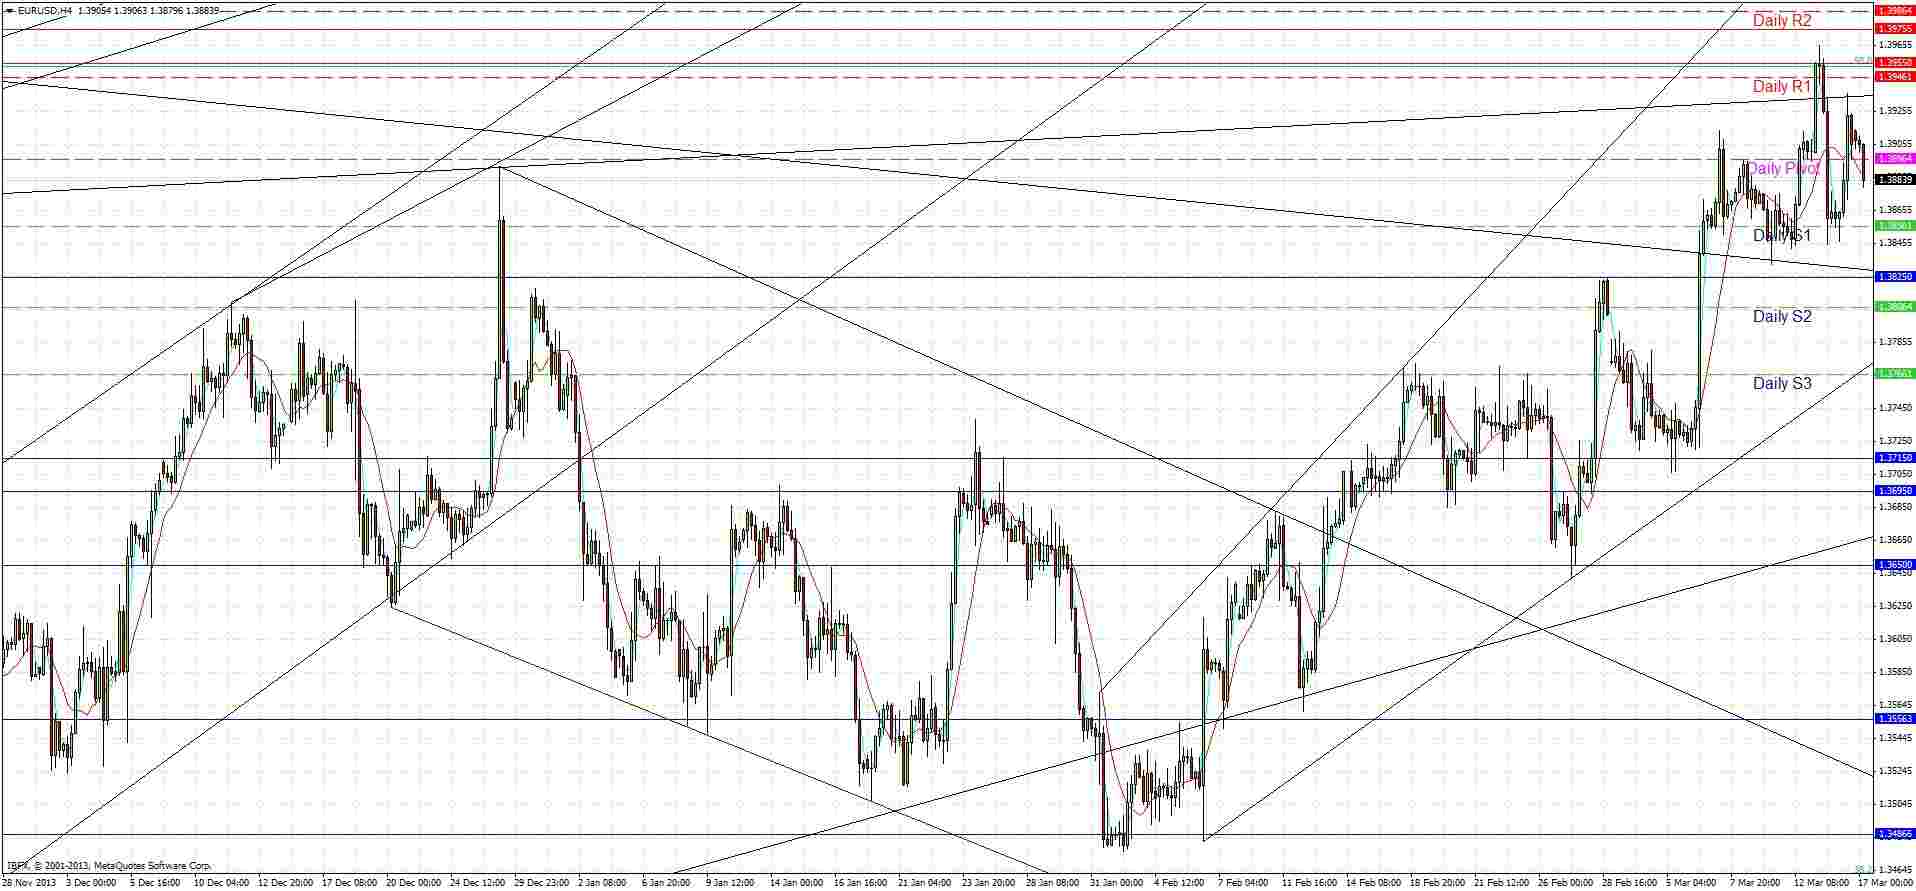
Last Thursday we had a sharp fall from the resistance level I had identified at 1.3955. However Friday saw the price bounce back with pretty strong bullishness all the way back to above 1.3935. The situation is dominated by trend lines. There is a multi-year bearish trend line below us at around 1.3825 which we have broken above and which has acted as support. Above us there is the upper trend line of a multi-year bullish channel which was confluent with the fall on Thursday. There is also a more recent bullish channel that we have been well established within since the beginning of 2014. Although the picture is bullish, these important trend lines have been very decisive and continue to be so; therefore it seems worth putting a lot of weight on them.
A candlestick analysis shows bullishness on all the higher time frames, although this is weakening slightly on the weekly and daily time frames as we were unable to end last week on a significant new closing high.
Below us resistance keeps flipping to support and we have several levels to bump into should the price fall. The first such level is at 1.3825 and that is the only one likely to be relevant today. It is right now confluent with the broken bearish trend line so should be supportive. There is also a shorter-term bullish trend line not far away. If the price is to fall back below there, that would be a very bearish sign.
Above us there are resistant levels at 1.3955 and 1.3975 very close by. These are confluent with the major 50% Fibonacci retracement of the multi-year down move. We already hit that and 1.3955 so I am only looking to short if we get to the next level at 1.3975.

Today there are no scheduled high-impact data releases relevant to either the EUR or the USD, so it is likely to be a quiet day.
