EUR/USD Signal Update
Yesterday’s signals were not triggered and expired.
Today’s EUR/USD Signals
Risk 0.50%
Entries must be taken only before 5pm London time today.
Long Trade
Enter long with a buy limit order at the first touch of 1.3715.
Put a stop loss at 1.3684.
Move the stop loss to break even once the trade is 25 pips in profit. Remove 50% of the position as profit at 1.3745, and leave the remaining half to run.
Short Trade 1
Go short following a next bar break of any bearish pin or engulfing hourly candle forming after the first touch of 1.3878. After two hours from the close of the first hourly candle above 1.3878, the trade should no longer be taken.
Put a stop loss one pip above the local swing high.
Move the stop loss to break even once the trade is 25 pips in profit or as soon as the price reaches 1.3850. Remove 75% of the position as profit at 1.3805, and leave the remaining 25% to run.
Short Trade 2
Enter short with a sell limit order at the first touch of 1.3955.
Put a stop loss at 1.3985.
Move the stop loss to break even once the trade is 25 pips in profit. Remove 50% of the position as profit at 1.3885, and leave the remaining half to run.
EUR/USD Analysis
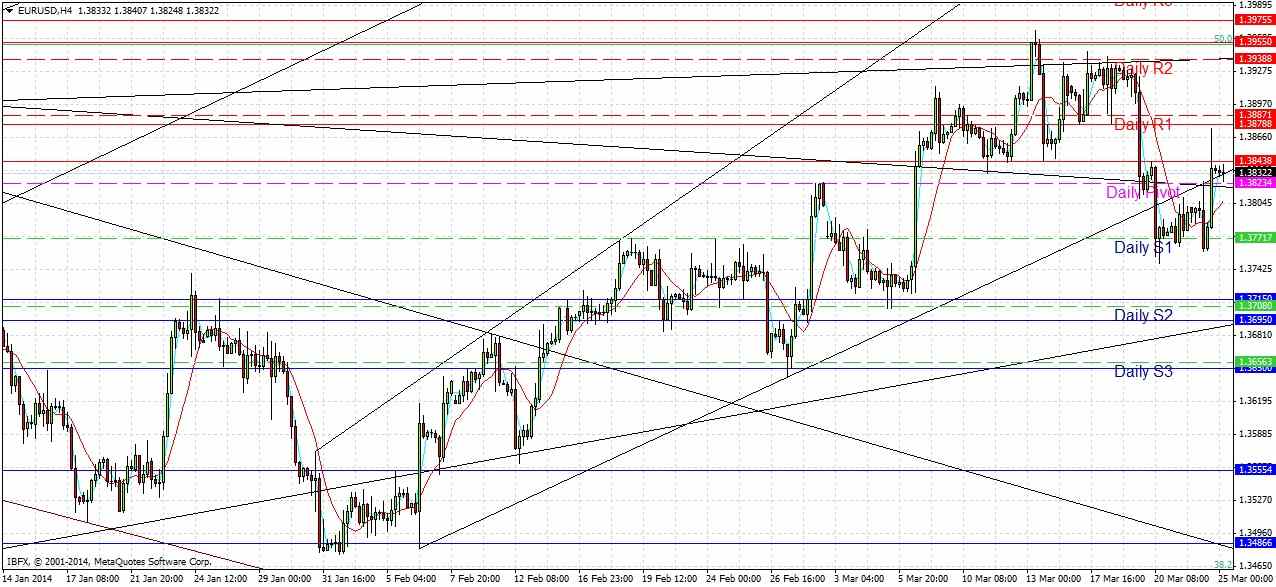
Yesterday was fairly confusing. Following a near-retest of the broken bullish trend line from the bearish side, the hourly chart produced a near pin candle from which the price initially fell sharply, but bottomed quickly at the key psychological level of 1.3750 before spiking back up sharply and even moving up beyond the broken bullish trend line before falling back through it. This calls that trend line into question, and if it is not respected today I will delete it from the chart.
The previous marked resistance level at 1.3844 kind of held as the price quickly fell back below it after the spike, but it is not reliable as a level at which to look for a short. However, we have a higher bearish level now at 1.3878, which acted as support and now seems to have become resistance. If the price returns here I will look for a short if confirmed by bearish price action.
There is a still a solid bullish trend line below us that has held for half a year. It is close to the key support levels at 1.3715 and 1.369,5 so we are likely to find some support there.
A candlestick analysis of the higher time frames shows the daily and monthly charts looking quite bullish, but the weekly is still showing bearishness.
It looks like we are quite probably in for a pretty directionless, ranging day. My colleague Christopher Lewis agrees.
There are important data releases due for both the EUR and the USD today. At 9am London time there will be the German IFO Business Climate data and then later at 2pm there will be US data (CB Consumer Confidence and New Home Sales).


