EUR/USD Signal Update
Last Thursday’s signals were not triggered and expired.
Today’s EUR/USD Signals
Risk 0.75%.
Entries may only be made between 8am and 5pm London time.
Short Trade
Enter short following the next bar break of any bearish pin or engulfing H1 bar that forms following the first touch of 1.3830. After an hour following the close of the first H1 bar to close above 1.3830, the trade is invalidated.
Put the stop loss 1 pip above the local swing high.
Move the stop loss to break even when the trade is in profit by at least 25 pips. Take off 50% of the position as profit at 1.3780 and let the remainder of the position ride.
Long Trade
Enter long at the first touch of 1.3650.
Use a stop loss of 26 pips.
Move the stop loss to break even when a profit of 25 pips has been reached. Take off 50% of the position as profit at 1.3695 and let the remainder of the position ride.
EUR/USD Analysis
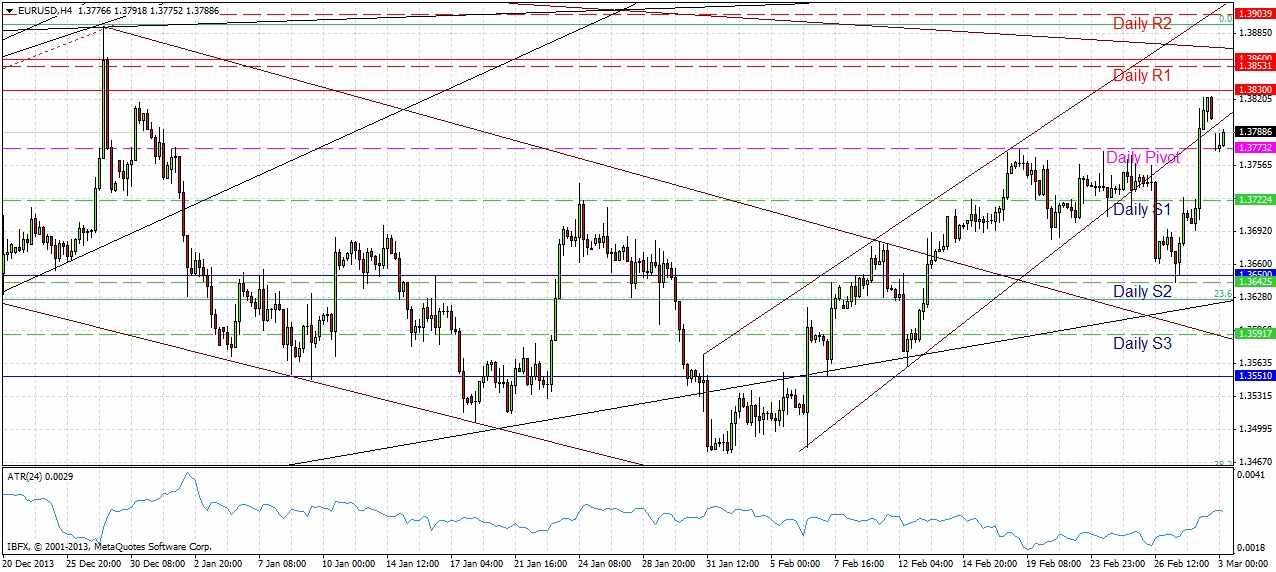
The first part of Thursday saw the price continuing its fall, until it reversed sharply at 1.3640 and drove up during the remainder of the week, almost hitting the key resistance level of 1.3830 before falling off slightly just prior to the weekly close.
I see the bullish reversal at 1.3640 as significant, as there was resistance around this level on 12th February before the price broke up through it. Therefore I see 1.3650 as having flipped from resistance to support and again becoming a key level, just as it was in January. This is a bullish sign as we now have another key support level that has formed above 1.3551.
Despite these bullish developments, the zone of resistance that begins at 1.3830 has been very strong and has resisted two attempts to break upwards during recent months. Although we came very close to reaching 1.3830 only on Friday, I still see it as a great selling opportunity that could be good for another move down. Christopher Lewis sees a strong bearish trend line from the monthly chart that is currently sitting at about 1.3900 which should be very resistive.
The bullish channel has been broken and re-entered and as such the bullish trend line is probably not important any more. Nevertheless I will leave it there for a while just in case it comes in useful over the next day or so.
Candlestick analysis is now showing strong bullishness on the monthly and weekly time frames, but weaker bullishness on the daily time frame.
Note that a new resistance turned into support zone may be forming this morning at the GMT daily pivot at around 1.3773.
The President of the ECB is speaking at 2pm London time today. At 3pm there will be the release of ISM Manufacturing PMI data concerning the USD. It therefore seems likely the pair will be quiet until the New York session.


