Gold prices fell 1.4% on Wednesday, extending their losses to a second straight session, on technical selling and signs of stabilization in the risk environment. Russian President Vladimir Putin’s decision to pull troops from Ukraine border soothed market fears (at least for now) that the crisis will escalate further. Stocks also rose yesterday, giving less reason for investors to buy gold, following Fed Chair Janet Yellen's testimony before the Joint Economic Committee of Congress.
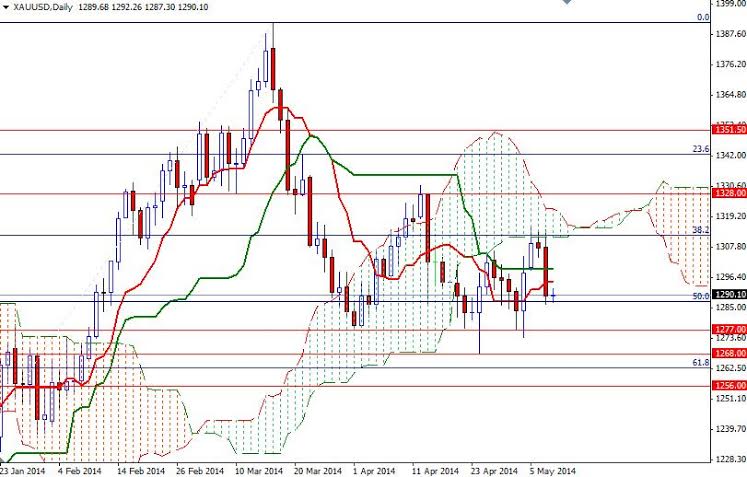
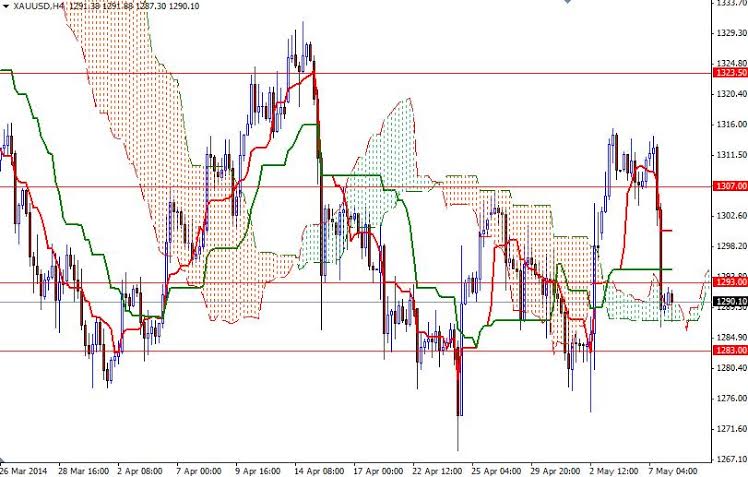
There are various variables affecting the gold market and because of that I will be paying more attention to the technical levels. So speaking strictly based on the charts, I think the Ichimoku clouds on the daily and 4-hour time frames will continue to play an important role in the market. In my previous analysis, I had warned about the strong resistances ahead and said that climbing over the cloud on the daily chart was essential for bullish continuation.
Although this is still valid, we also have to pay attention to the 1268 level which acted as both support and resistance several times in the past. From an intra-day point of view, resistance to the upside will be found at 1293 and 1300. If the XAU/USD pair closes back above 1300, then we could see a retest of the 1307 level. To the down side, I will be watching the bottom of the cloud (4-hour chart) which also happens to the 50% retracement based on the bullish run from 1182.35 to 1392.04. If the selling pressure continues and the XAU/USD pair breaks below yesterday's low, I will look for 1283 and 1277. A close below 1277 would suggest that we are heading back to 1268 at least.


