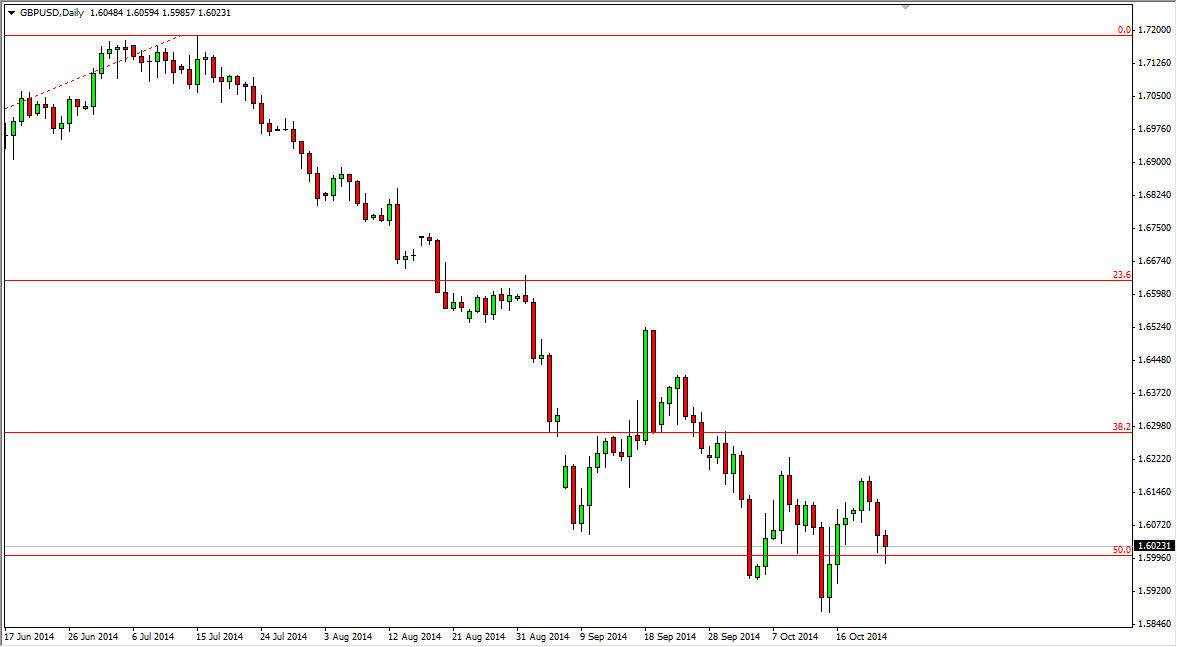
The GBP/USD pair fell initially during the session on Thursday, but as you can see found quite a bit of support at the all-important 1.60 handle. This is an area that’s important to me because it is the 50% Fibonacci retracement of the uptrend, and the market formed such a beautiful looking hammer for the previous week. In other words, there were plenty of reasons the think that the buyers could come into play here. With the United Kingdom releasing its GDP numbers for Q3 today, it’s very likely that we will have some volatility in this marketplace.
If we break the top of the hammer, I think that we will then try the 1.62 level, and a break above the 1.63 level would be a longer-term buy-and-hold type of situation as far as I can see. I think that based upon the longer-term charts, we could end up going back to the 1.72 handle given enough time. I don’t think it’s going to happen anytime soon obviously, but that is my longer-term thought process.
Could this be the turning point?
Based upon the hammer on the weekly chart in the 50% Fibonacci retracement level, this could very well be the turning point in the British pound. If that’s the case, there are people out there that are going to make quite a bit of money by going long at this point. It’s very difficult for me to sell at this point in time, at least not until we get below the 1.59 level on a daily close. At that point in time, obviously things would be very negative as it would show a breaking below of the hammer from the weekly chart. That of course is always negative, and could send this market racing much lower. However, I still prefer the upside because I feel that this market is trying to form a classic bottom, and the GDP number could in fact be a nice catalyst to push this market higher as the British economy improving certainly would have people looking to higher interest rates as an attractive feature of this market.

