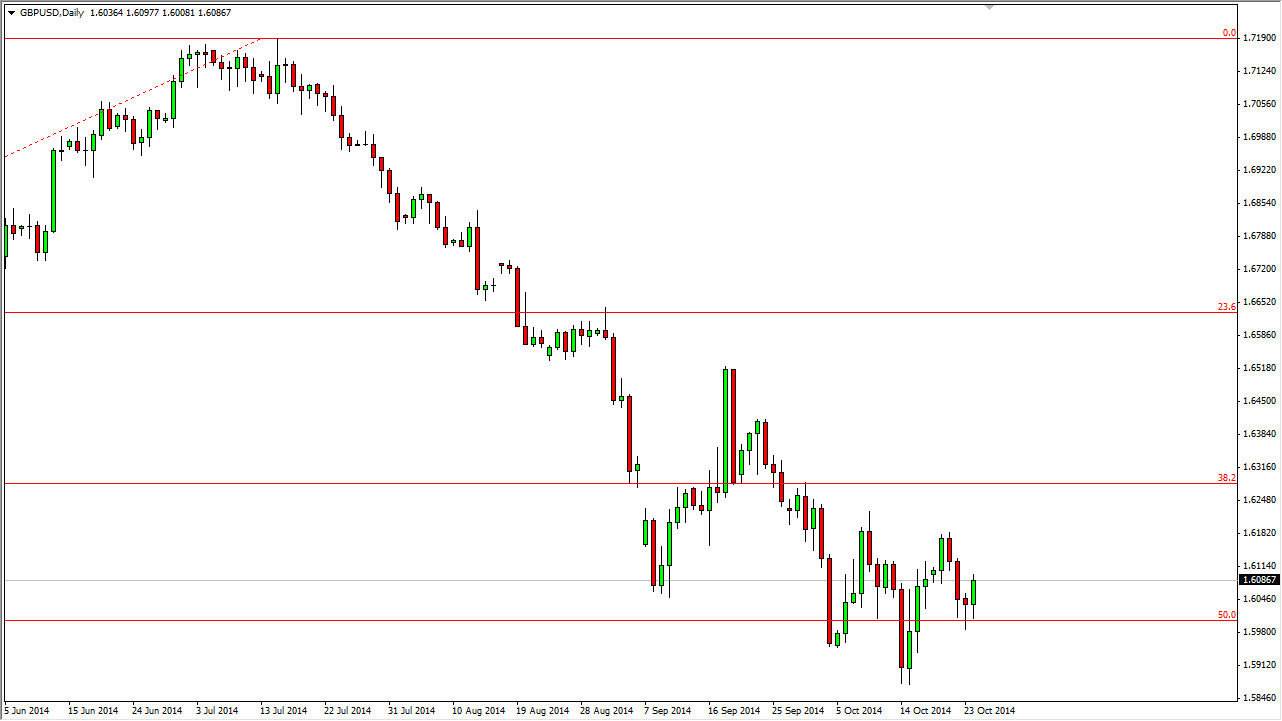
The GBP/USD pair fell initially during the session on Friday, but found enough support near the 1.60 level to turn things back around and form a hammer candle. More importantly, we ended up breaking the top of the hammer from the Thursday session, so this of course is a very bullish sign. You also have to keep this in context of the fact that the previous week formed a hammer as well on the weekly chart. Because of that, I am very bullish at this point in time, and will continue to buy the British pound every time it dips in this marketplace.
Ultimately, I do believe that this market will break out but the 1.63 level above is essentially the gateway to much higher prices. Looking at the longer-term charts, we have recently tested the 50% Fibonacci retracement level, which of course is a major area of support on most pullbacks. Because of this, we could see a longer-term move to the 1.72 level given enough time. While I can’t guarantee that obviously, this does have the look of what could potentially be a very nice longer-term trade.
Fresh new lows
I would have to see fresh new lows in order to start selling this market, which is something that does not look so likely at the moment. On top of that, it’s very likely that if we break above the 1.63 level, this market could eventually be recognized for forming an “inverted head and shoulders pattern”, which of course is very bullish. That would be enough to get a lot of people involved in this marketplace, and pushing the British pound higher.
On top of that, the US dollar is a bit overbought against most currencies, but the United Kingdom is doing a bit better than many of the other drivers of US strength. After all, the United Kingdom does not have the same issues that the European Union does, so it would not be surprising to see this market be a little bit of an outlier as compared to other US dollar markets.

