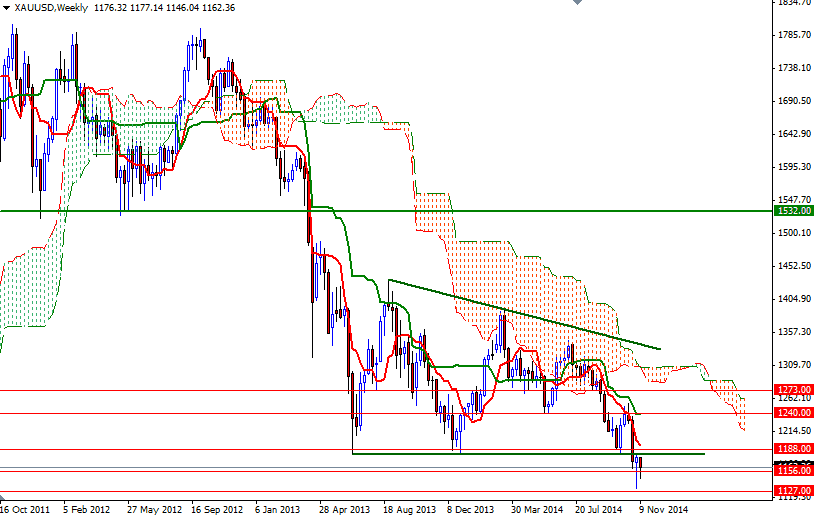
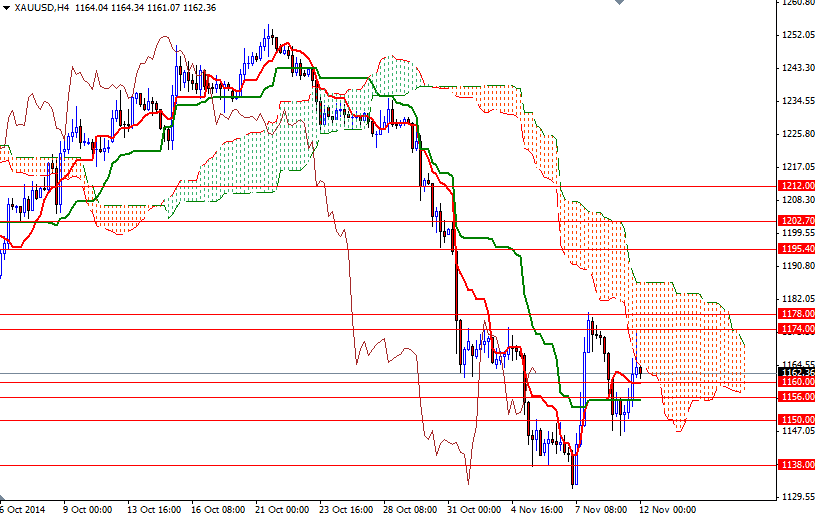
The XAU/USD pair had a positive day as weakness in the American dollar increased investors' appetite for gold. The market initially tested the support in the 1.1150/45 region but prices turned bullish after trading that low and reached the 1174 level where the Tenkan-sen line (nine-period moving average, red line) and a former support dating back 2010 coincide on the daily chart. The market is currently trading at $1162.36 but we are about to enter the Ichimoku clouds on the 4-hour chart.
One of the basic tenets of technical analysis is that previous support, once broken, becomes a future area of resistance, That means downside risks remain as the market trades below the 1183 level which was the bottom the descending triangle originating in June 2013. However, the market often returns to a level it has struggled to break out of before resuming the trend and because of that I think the area between 1183 and 1188 will play an important role in this market's future.
With that in mind, I expect the near-term trading range to be roughly between 1145 and 1178. If the bulls gain more traction and penetrate the 1178/4 resistance, they will be aiming for the 1183.66 level next. Beyond that, the bears will be waiting at 1188. If the bears win the fight and prices fall below 1156, the XAU/USD may test the supports at 1150 and 1145 once more. Closing below 1145 would increase the possibility of a fresh attempt to revisit the 1138 level.


