Gold continued to retreat from a three-week high struck this week, as the strength of the dollar and the recovery in equity markets helped push prices down another $2 to $1208.61. In economic news, the Labor Department reported that applications for jobless benefits fell 4K to 294K. Market participants are likely to remain cautious ahead of the key U.S. non-farm payrolls report later in the day. Wednesday's upbeat private employment data fanned hopes for a strong reading.
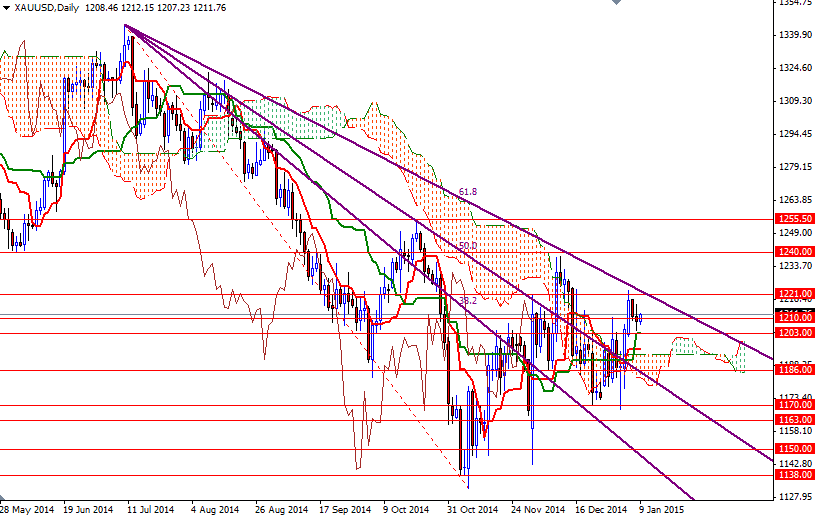
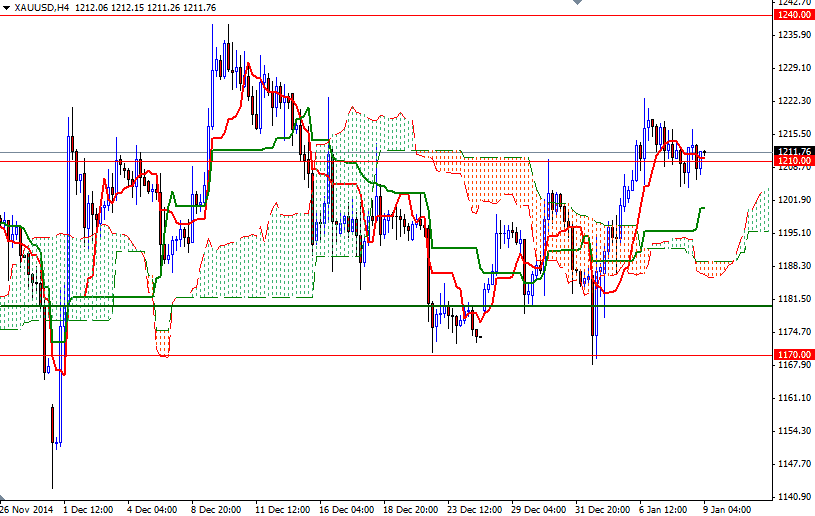
For quite some time, gold and stocks have maintained an inverse correlation. Lately, the bulls took advantage of weakness in U.S. and Japanese equities and pushed gold prices above the Ichimoku clouds on both the daily and 4-hour charts but the recent stabilization in these markets is easing the demand for disaster insurance. Gold prices have been oscillating around the 1210 level while the 1221 and 1203 levels contain the market.
The medium term outlook suggests that the path of least resistance for gold is to the north. So until the market drops back below the clouds and we have a bearish Tenkan-Sen (nine-period moving average, red line) - Kijun-Sen (twenty six-day moving average, green line) cross, there will not be any technical reason to sell. However, as I have been repeating for the last few days, there will not much room to go unless the resistance at 1221/5 is broken. If the bulls gain enough strength and push the XAU/USD pair above the 1225 level, then it is entirely possible to see the market challenging the 1235/40 resistance. The bears will have to drag the pair below the 1203 level if they don't intend to surrender. In that case, I think the next stop will be the 1193.54 level where the top of the Ichimoku cloud reside.


