USD/CAD Signal Update
There are no outstanding signals.
USD/CAD Analysis
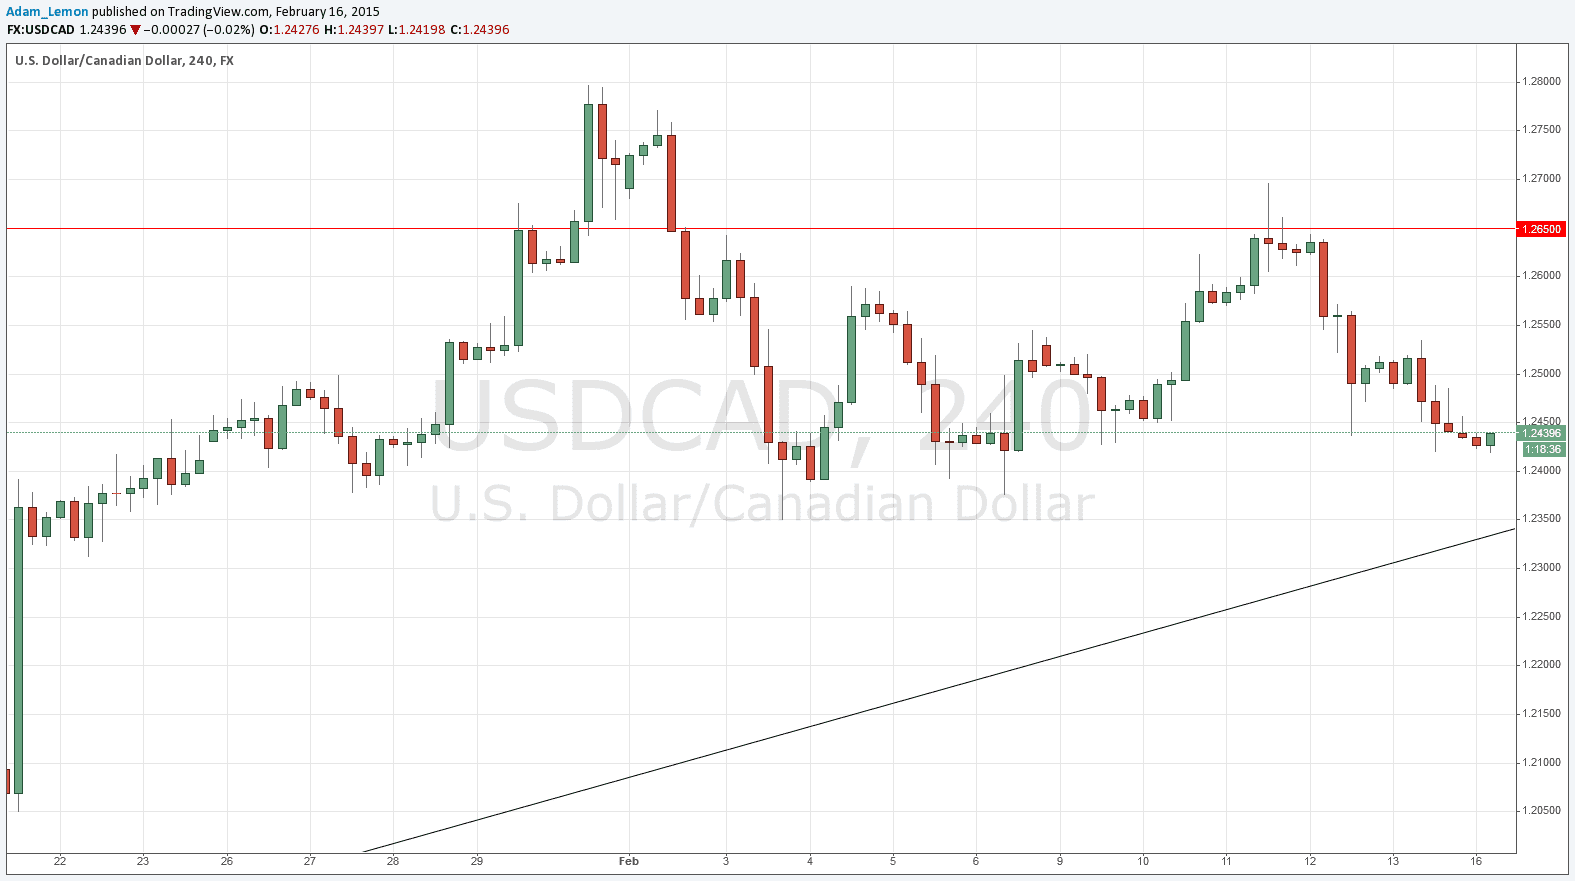
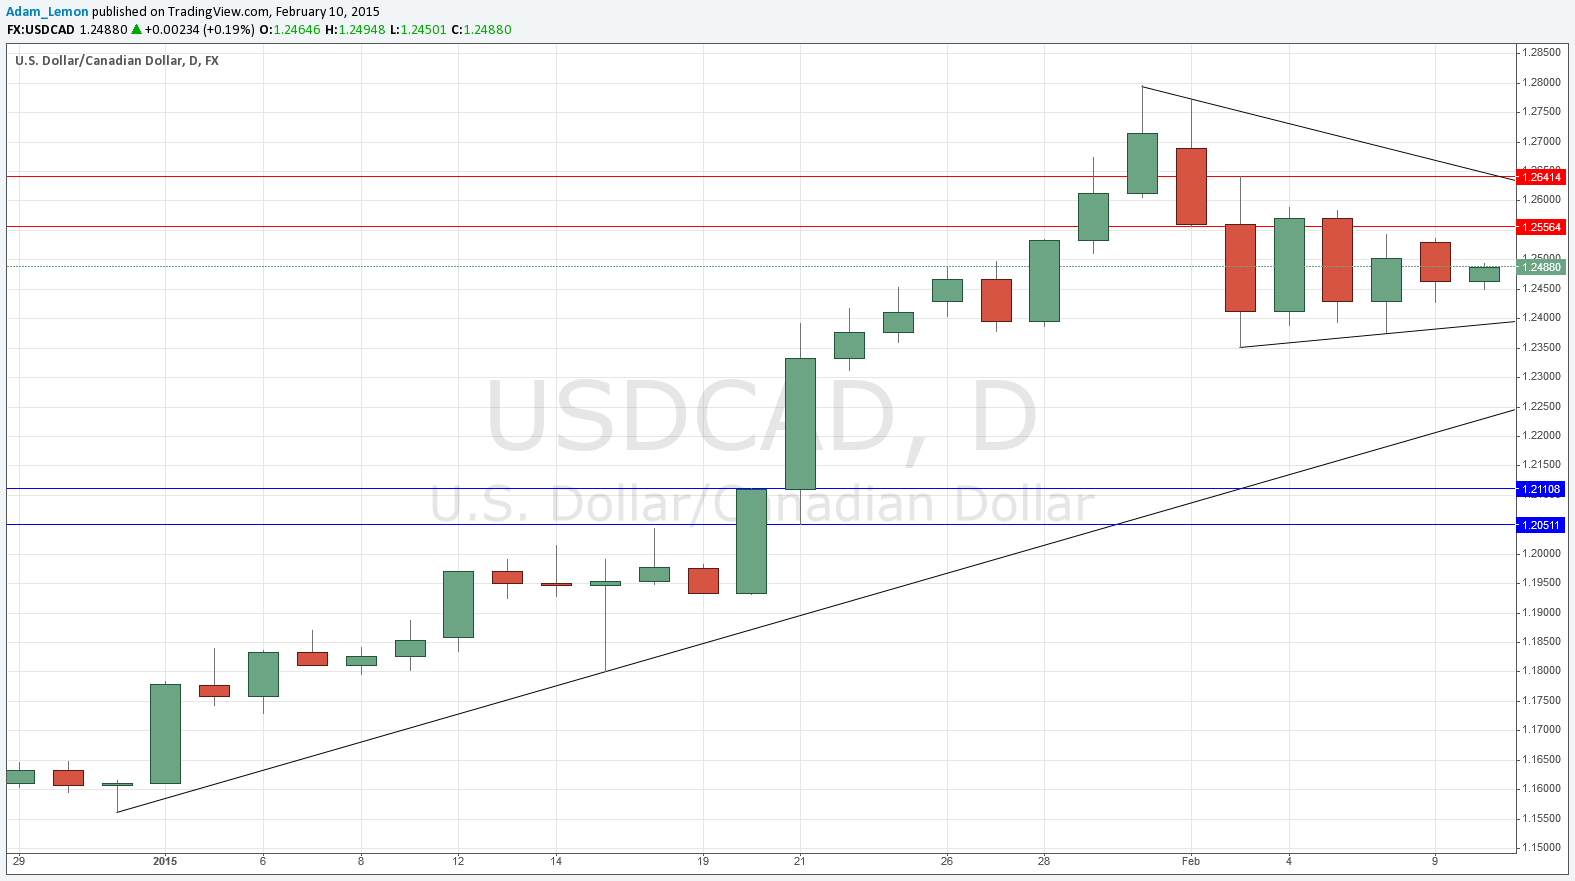
In last Tuesday’s forecast I identified an inner lower trend line, noting that if there was a break down through this line the pair would probably continue to fall to reach the longer-term bullish trend line. Both the trend lines are shown in the first chart below:
The resistant area I identified at around 1.2650 did act as strong resistance and following an initial move up to this price, there was a sharp fall, probably caused mainly by another sudden strengthening in the price of crude oil which might have formed a short-term double bottom below $50 by now.
It looks likely that we will fall to around 1.2350 which was a previous key swing low and will very shortly be confluent with a long-term bullish trend line, so it would be a logical point at which to expect the beginning of some kind of upwards move:
It seems likely that this pair has topped out at least for the next several weeks, so the best trades in the near future are likely to be short trades. The next best opportunity will probably come after a move up from 1.2350, and the short-term chart suggests that a pull back to the area at around 1.2500 should then reach enough supply to begin falling heavily again.
To be convincing, any upwards move will have to break above 1.2650 and hold it for a while.


