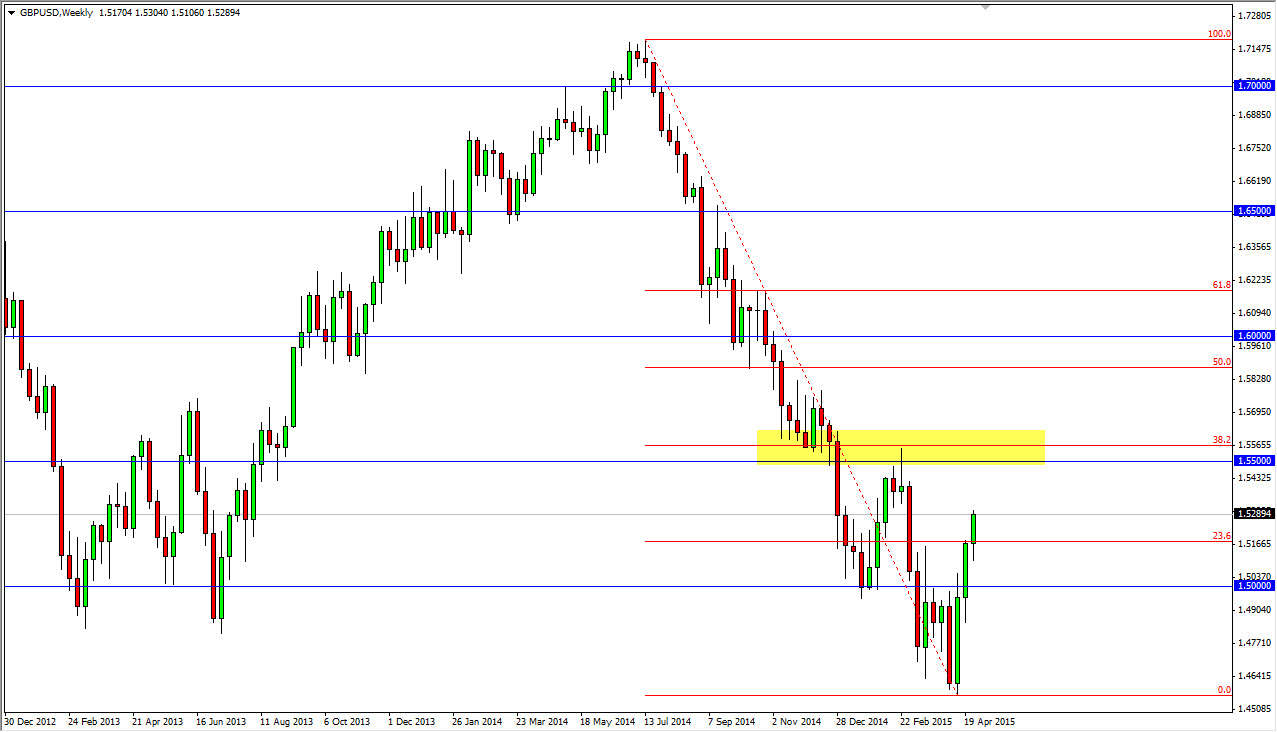
The GBP/USD pair initially fell most of this year, but found a hard landing at the 1.45 level to be just the reason to start bouncing again. However, I think that we are about to run into significant resistance. On the attached weekly chart, you can see that I have a shooting star highlighted at the 1.55 level. This is because it is not only a resistive candle, but it is also a large, round, psychologically significant barrier. Adding credence to this area is the fact that it is also the 38.2 Fibonacci retracement level. With that, it’s very likely that there is going to be a certain amount of resistance in that general vicinity.
With that being said, I believe that we will probably reach towards the 1.55 level early in the month, but eventually the sellers will come back. One of the main reasons I think this is that the recent rally has been so sharp that it’s difficult to imagine this type of momentum keeping up. After all, the market cannot go in one direction forever and we have moved over 700 pips in what is essentially a straight line up.
I’ll be looking for resistive candles near the 1.55 handle, especially on the daily charts. I think the British pound will show itself and what it plans on doing quite plainly on this chart. I believe that the fall from the 1.55 level could be rather drastic as well. However, you have to keep in mind that markets can of course be a rational for much longer than you can remain liquid. In other words, it could keep going higher.
Even with that in mind though, I can see a significant cluster of resistance just above the 1.55 handle. With this, I think it’s only a matter of time before the sellers come back, but I think you’re going to have to be fairly patient and wait for that opportunity. Let them rally the British pound in the meantime, simply sit on your heels and wait for the opportunity to make a big play to the downside.


