Gold fell to its lowest level in six sessions on Wednesday as the greenback rallied across the board following better than expected housing data. The XAU/USD pair fell sharply and traded as low as $1185.62 per ounce after data released by the National Association of Realtors revealed that existing home sales increased 6.1% to an annual rate of 5.19 million units in March. Meanwhile, U.S. and Japanese equities strengthened, abating investors' appetite for the precious metal.
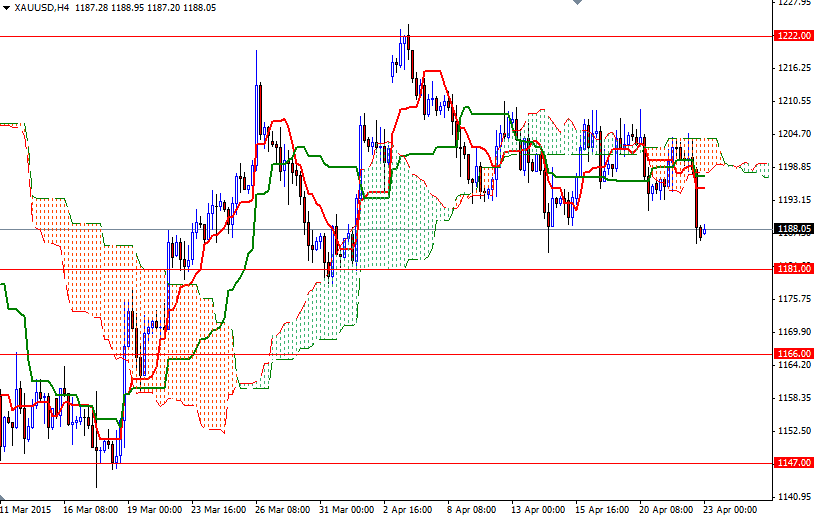
Yesterday's price action which dragged the market back below the 1191 support level implies that the short-term technical outlook has shifted to the downside. On the 4-hour time frame, the Tenkan-sen line (nine-period moving average, red line) crossed below the Kijun-sen line (twenty six-day moving average, green line) and XAU/USD is trading below the Ichimoku cloud. Plus, The Chikou-span (closing price plotted 26 periods behind, brown line) dropped below prices on the same chart.
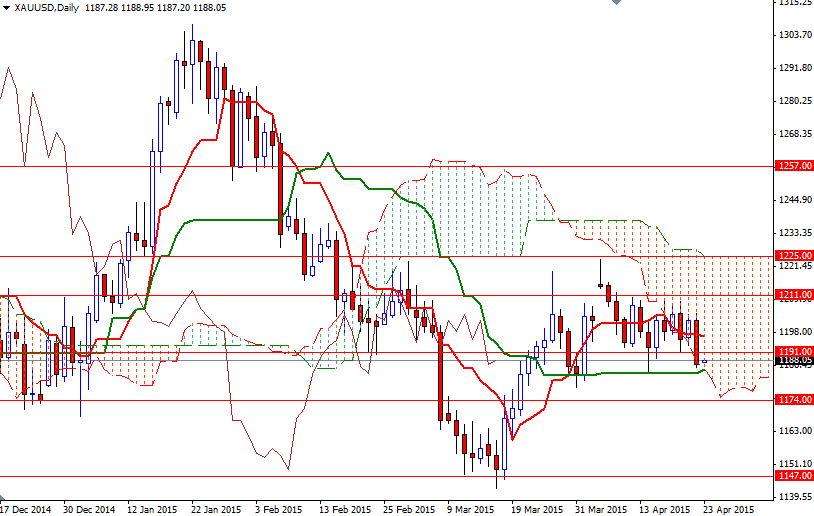
Despite the negative short-term outlook, I will keep an eye on the 1184/1 area where the 23.6 Fibonacci (based on the decline from 1307.47 to 1142.63), bottom of the daily cloud and daily Kijun-sen line reside. Since the area between the 1191 and 1195 levels played an important role in the market recently, the XAU/USD pair may pay a visit to there. The bulls will have to push prices above the clouds (4-hour chart) if they don't intend to give up. Only breaking through the barrier at 1205 could ease the pressure on gold prices and open the doors to the 1211. However, any failure to any failure to climb above 1195 might encourage sellers. If the bears are able to maintain control and shatter the support at 1181, then their next targets will be 1174 and 1166.


