Gold prices ended Monday's session down 0.76%, or $9.15, to settle at $1195.61 an ounce as U.S. equities rallied and the greenback steadied. The economic calendar does not see a lot of major items in this week, so people are focusing on earnings reports and developments in the euro zone (i.e. Greek debt drama) when allocating their money. The major equity markets remains more attractive and consequently investors demonstrate limited interest in gold.
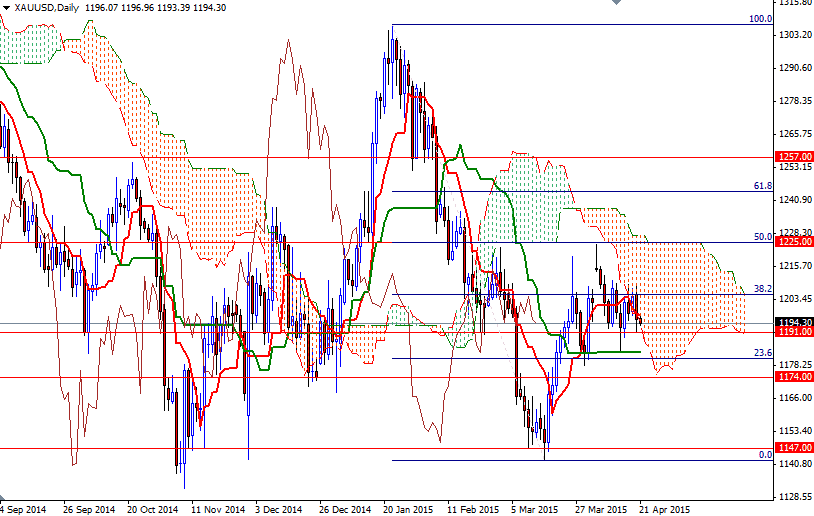
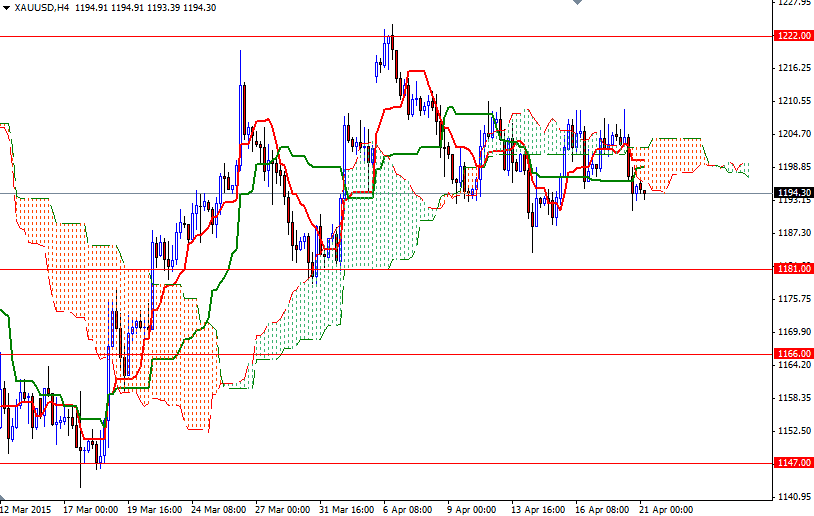
However, the XAU/USD pair continues to trade within the range of the previous eight sessions. Gold prices have been trapped between the weekly Tenkan-sen (nine-period moving average, red line) and Kijun-sen (twenty six-day moving average, green line) lines for more than two weeks. In addition to that, both lines are almost flat on the daily and 4-hour time frames. Until we break out of this trading range (roughly between 1191 and 1211) the market will tread water.
While a sustained break above 1211 would set the XAU/USD pair up for another test of the resistance at the 1214.50 level, falling through 1191 could open up the risk of a move towards the 1183.27 - 1181 region. Once we get through 1214.50, the real challenge will be waiting the bulls at the 1225 level where the top of the daily Ichimoku cloud and the 50% retracement level (based on the distance between 1307.47 and 1142.63) coincide. The bears will have to drag XAU/USD below 1181 if they intend to make a fresh assault on the 1174 level.


