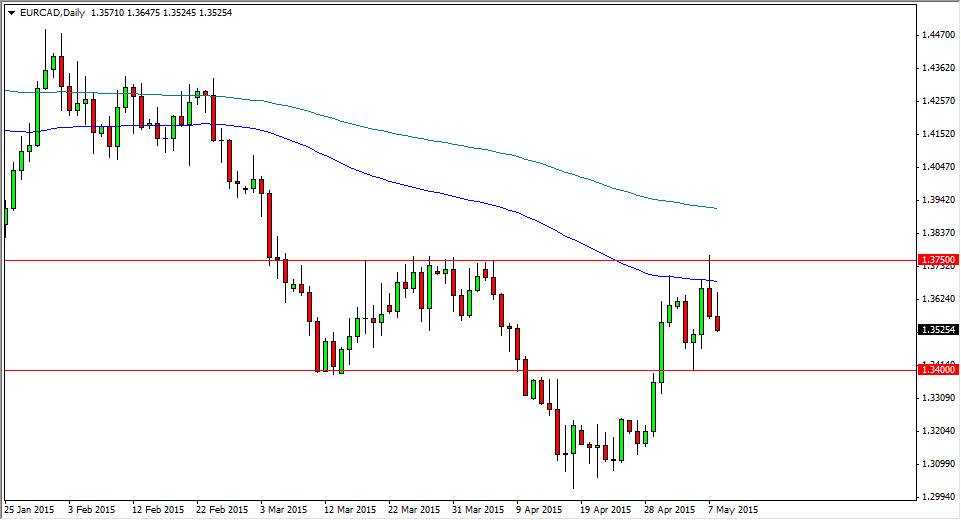
The EUR/CAD pair tried to go higher initially during the session on Friday, but found enough resistance at the 100 day exponential moving average to turn things back around and form a shooting star. It does in fact look like a market that is starting to “roll over”, and as a result I believe that we will continue to fall. A break below the bottom of the shooting star probably sends this market looking for support at the 1.34 level. This is an area that was pretty supportive just a few sessions ago, and of course was resistive back during the month of April. With that, it’s very likely that there will be a bit of action in that area.
Depending on what happens in the oil markets, this could be a quick move or a slow move. If oil markets break out to the upside than it would make sense that this pair would fall as the Canadian dollar is very highly leveraged to the oil markets. On the other hand, if the oil markets do not break out to the upside, this market might just simply drift sideways with a slightly bearish bias.
Selling rallies
You can see that the 2 exponential moving average is on the chart are just above current pricing. The blue line is the 100 day exponential moving average, while the dark line is the 200 day exponential moving average. In other words, long-term traders will still look at this as a very negative market, and should continue to be fond of selling and not interested in buying. With that, I believe that you can sell rallies that show signs of resistance on shorter-term charts such as the hourly or the 4 hour chart. I think that we will test the 1.34 level for support, and if we break down below there we should then go to the 1.30 level given enough time. I don’t really have any interest in buying at the moment, but if we broke above the 1.3750 level, I would have to start thinking about doing so.

