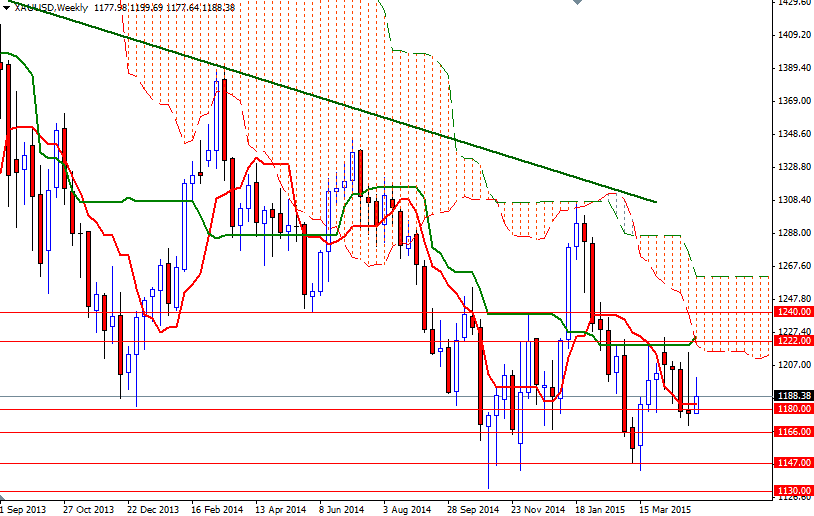
Gold prices ended Friday's session up 0.4%, or $4.30, to settle at $1188.38 an ounce as U.S. jobs data eased investors’ concerns about how soon the Federal Reserve would raise interest rates. Figures from the Labor Department showed that the U.S. economy added 223K jobs in April and the unemployment rate dropped to 5.4% from 5.4%. Data has bolstered the view that softness earlier this year was indeed caused by severe winter weather, not inherent economic weakness. However, significant downward revision to March (to 85k from 126k) and slow rate of wage growth dimmed prospects for an interest rate hike in June
The market has been stuck in a relatively narrow range since late March. So far gold prices have been continuously held in check by the key 1225 barrier while buying interest near the 1174 level put a floor in trading range. The market's inability to penetrate the daily Ichimoku cloud paints a weak technical picture, especially when the broader directional bias remains weighted to the downside. Technically these clouds not only identify the trend but also define support and resistance zones.
In other words, downside risks remain as the market trades below the 1225/2 area which happens to be top of the daily cloud. The weekly Kijun-sen (twenty six-day moving average, green line) also reside in the same region, therefore breaking through this barrier is essential for an upswing. But of course, in order to reach there, the bulls have clear nearby resistances such as 1199, 1207 and 1214.50. On the other hand, if the bears successfully defend their camp and pull XAU/USD back below 1174, then we are likely to proceed to 1166. Closing below this support would put us back on track with such a scenario eying subsequent target at 1147.


