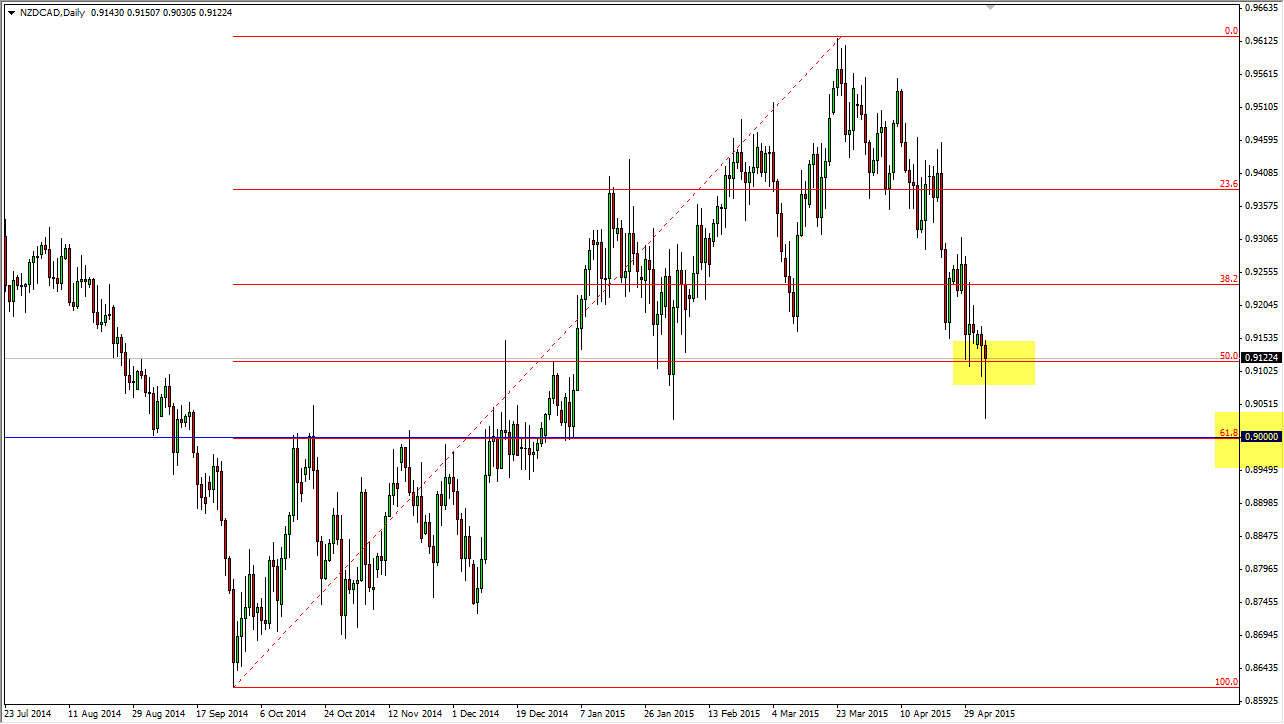
The NZD/CAD pair fell during the session on Tuesday, but found support exactly where you wanted to see it if you are hoping for a rally. The 0.90 level was obviously influential when it comes to the rally that we had later in the session, which of course formed the perfect hammer that you see on the chart in front of you. What I find interesting about this rally is that the 0.90 level is not only a large, round, psychologically significant number, but also the 61.8% Fibonacci retracement level from the lows back in September.
Adding more credence to this hammer is the fact that it actually closed right at the 50% Fibonacci retracement level. This is an area that has been supportive, in the form of the 0.91 handle. I believe that the New Zealand dollar looks fairly bullish all across the market right now, so the fact that it would rise against the Canadian dollar would not be that big of a surprise.
Playing the breakout
Looking at a hammer, if we can break above the top of the candle I am more than willing to start buying this pair. I realize that it will be a very choppy affair going higher, as there is clustering of several different levels. However, I think that this is more or less going to be a longer-term trade. We could go as high as 0.95 of the course of the next several weeks. I do not think that this is going to be the type of marketplace for short-term traders.
On the other hand, if we broke down below the 0.90 level, I would then anticipate a complete “round-trip” back to the 0.86 level where the rally started. Just as a break out to the upside would be, this would also be a very choppy move. In the meantime though, I have to believe in the support that I see on this chart, and therefore I am buying either a break out above the hammer, or some type of supportive candle.


