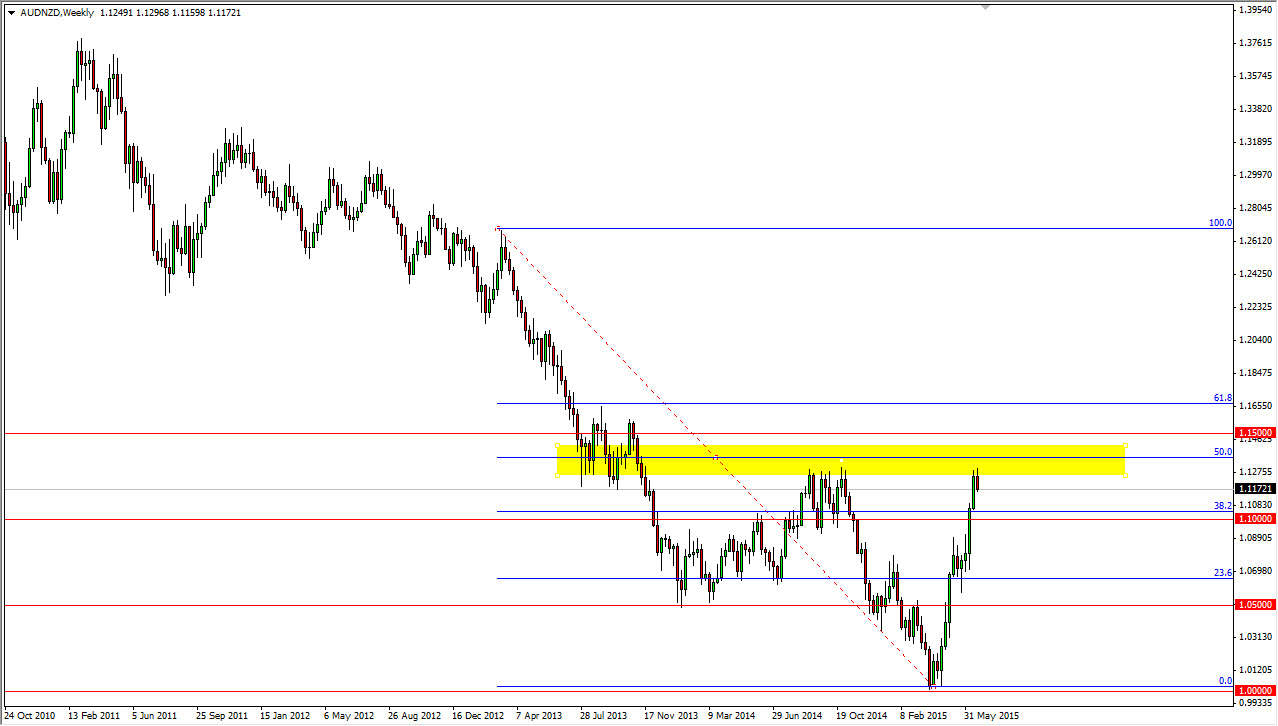
The AUD/NZD pair isn’t one that a lot of you trade, but truthfully it’s 2 major currencies, and therefore you have to pay attention to it. This is a great measuring stick as to which pair you may want to trade when it comes to the AUD/USD pair, or the NZD/USD pair. In other words, by using triangulation you can take the stronger of the 2 currencies and simply by that against the US dollar, or vice versa. While they are both commodity currencies, they obviously move against each other.
Now looking at the weekly chart, you can see that I have a yellow rectangle plotted and what is the 50% Fibonacci retracement level of the most significant and recent break down over the longer term. It is at roughly 1.13, and you can see that we did pullback a little bit from this area. On top of that, this was massively resistive and supportive in the past. Ultimately, I think that there is a significant amount resistance based on the cluster in July 2013 that extends all the way to the 1.15 level. In other words, I think this is a market that could very well fall from here.
Ready to start selling
I believe that this market will fall from here or somewhere just above. I believe that the Australian dollar continues to be one of the softest currencies out there, as I have several sell recommendations involving the Australian dollar against various currencies around the world. While I am not a huge fan of the New Zealand dollar, I recognize that this is simply a measure of relative strength between both of these currencies. I think that it’s only a matter time before we break down and head towards the 1.10 level. I believe that selling rallies the show signs of weakness will be the way to go, and I also believe that we could very well head back to the parity level given enough time. However, I will preface all of this with the disclaimer that once we reach the 1.16 level, the trend has changed in my opinion.


