Gold prices rose for a second day on Tuesday as European stocks fell on concerns about the lack of progress in negotiations between Greece and its creditors. Greece's bailout program with the International Monetary Fund and European Union expires at the end of this month and there are no signs of a deal yet. The retreat in stocks helped underpin gold prices but expectations of an interest rate hike by the Federal Reserve in September limited gains.
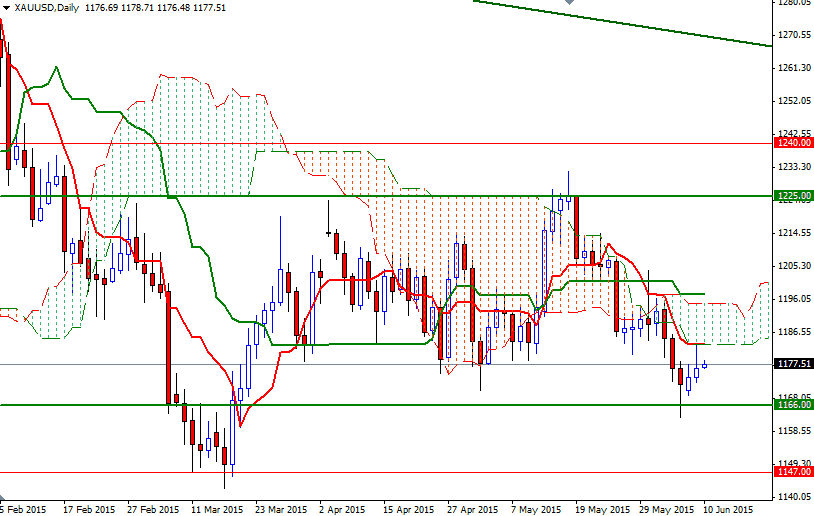
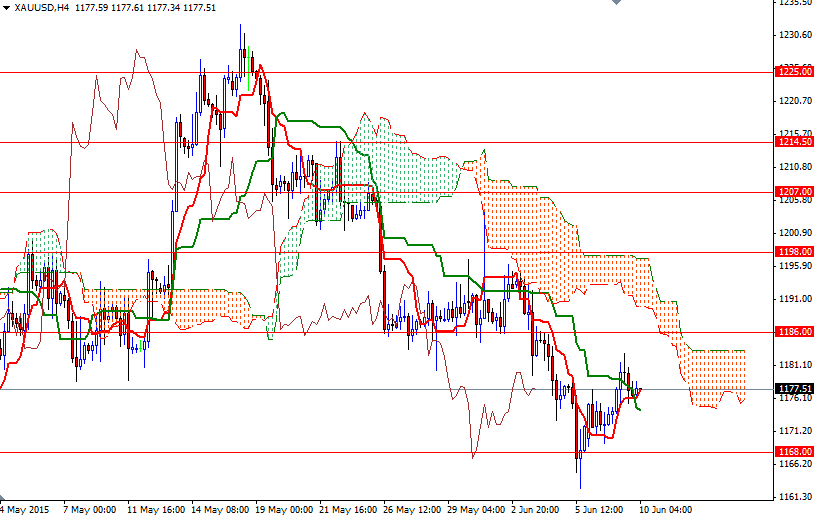
On the one hand, gold is finding some (temporary) support due to demand for protection against risks. On the other hand, the prospects of U.S. interest rates staying near zero for a long time is diminishing and that is keeping gold under pressure. Technically, moving below the weekly and daily Ichimoku clouds indicates that the bulls will have hard time gaining a strong momentum. As mentioned earlier this week, although I expect a rebound in the near term, the area between the 1183 and 1198 levels where a bunch of resistance converge will play a crucial role going forward.
We have a (weak) bullish Tenkan-sen (nine-period moving average, red line) - Kijun-sen (twenty six-day moving average, green line) cross on the 4-hour time and that suggests the XAU/USD pair has a tendency to rise towards the 1186/3 region. If the market pushes through, then we could see a test of the 1198/5 resistance. Breaking above this barrier would imply that the short-term technical outlook is shifting to the upside and XAU/USD is on track to head towards the 1225 area. However, if the market finds the 1186/3 zone too resistive to conquer, then the bears will probably try to make another attempt to the 1171 level. In order to increase speculative selling, the bears have to shatter the 1168/6 support on a daily basis.


