Gold prices rose 0.42% yesterday, posting the first gain in three sessions, and settled at $1186.07 an ounce. Gold’s rebound on Monday came as weak U.S. economic data hammered stocks and pushed investors towards the safe-haven metal. The XAU/USD pair initially tested the support around the $1174 level but reversed its course and headed higher after figures from the Federal Reserve showed that industrial production dropped 0.2% in May.
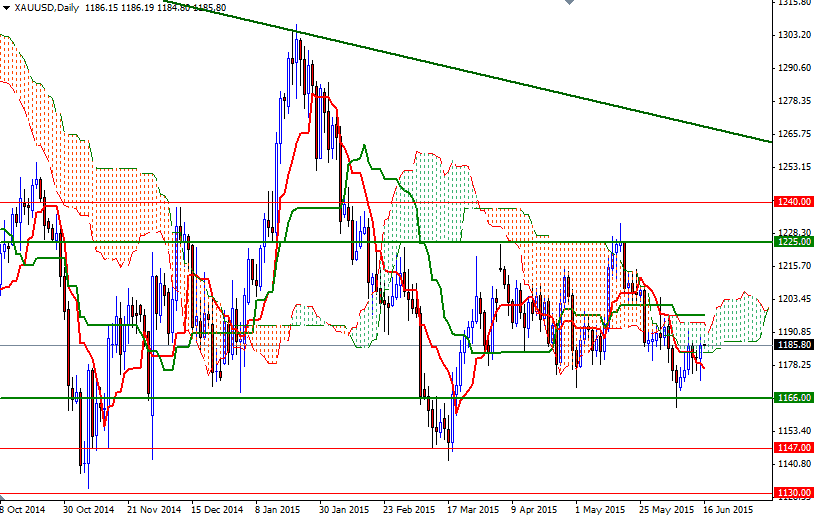
The market encountered resistance at 1190.33 and pulled back to the current levels. Pattern on the daily chart indicate that the market is trying to make some kind of bottom above the 1168/6 area. However, the short-term and long-term charts are giving us mixed signals. The weekly chart is favoring the bears as prices are below the Ichimoku cloud but the 4-hour chart is turning positive.
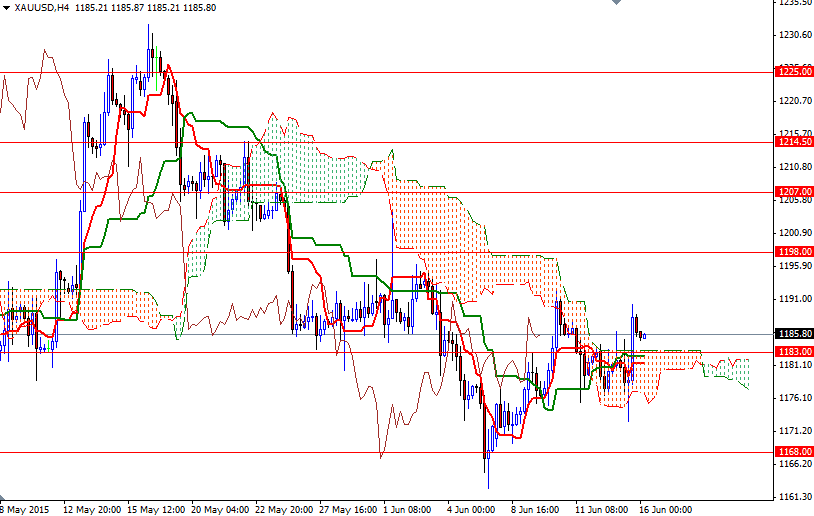
From an intra-day perspective, I think the key areas to watch will be 1191 - 1190.33 and 1183/1. If the bulls can hold the market above the 1183/1 region -where the top of the cloud, Tenkan-sen (nine-period moving average, red line) and Kijun-sen (twenty six-day moving average, green line) lines cluster- then it is likely that the pair will retest the aforementioned barrier. If the bulls push the XAU/USD pair above the 1191 level, I think we will gain enough traction to visit the 1202-1198 zone. On the other hand, if the bears take over and drag the market below 1181, the next stop will probably be the 1175/4 support. A successful dive below 1174 would suggest that the market will be aiming for 1168/6.


