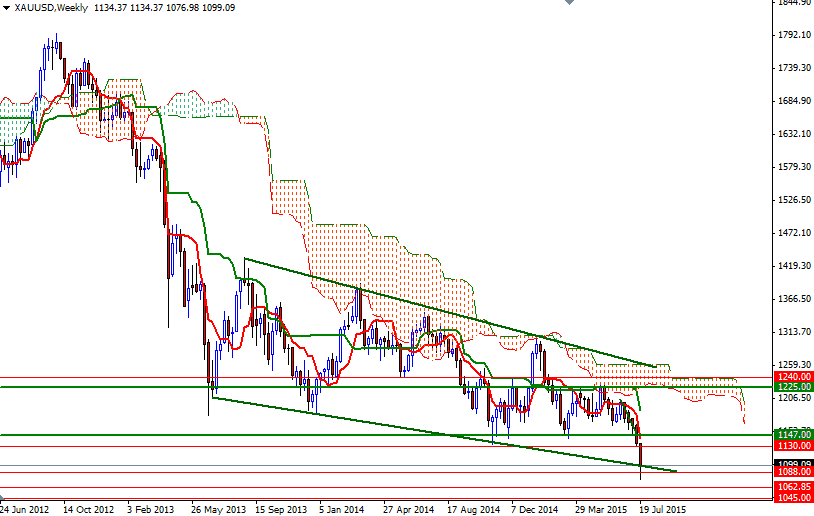
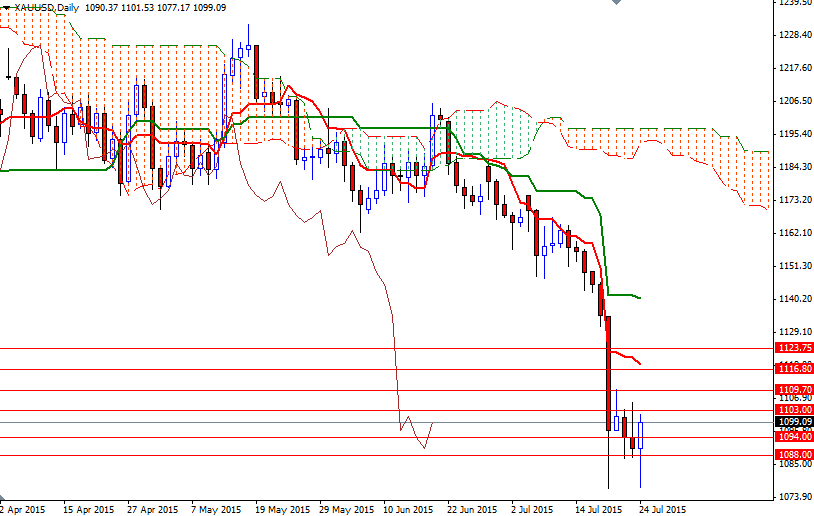
Gold prices ended Friday's session up $8.72, to settle at $1099.09 an ounce as weaker-than-expected data from the U.S. and declines in global equity markets sparked some short covering. Gold rebounded from the lowest levels since February 2010 after the Commerce Department reported that sales of new homes dropped 6.8% to a 482000 annualized pace. Despite Friday's gains, XAU/USD ended the week with a loss of 3.10%, or $35.28,
Although I think trading below the 1147/30 region is negative for gold, diminishing momentum is certainly something to watch, especially when there is a divergence between RSI and price action on the 4 hour time frame. Friday's candle also represents a sign of short-term exhaustion. In other words, it wouldn't be so surprising to see some short-side profit taking and a push up towards the 1130 level ahead of the Federal Open Marker Committee meeting this week. This is of course unless the market can penetrate the support at the 1076 level on a daily basis. If XAU/USD makes a sustained break below 1076, then look for further downside with 1071, 1062.85 and 1045 as targets. The initial support to the downside now stands at 1088/6.
On the other hand, if prices continue to rise and pass through the 1103/1 area, we could possibly witness the market testing the 1109.70 level. The Ichimoku clouds (4-hour chart) currently occupy the area between roughly 1109 and 1124 so expect to see resistance. A break above 1124 could spark a pull-back going all the way up to 1133/0 or perhaps 1147. This area which served as a floor for a significant amount time should now act as good resistance.


