The AUD/SGD pair probably isn’t one of your more common pairs to trade, but at the end of the day it makes sense as it is two strong Pacific currencies. After all, we have the Australian dollar which of course is very heavily influenced by commodities, and the Singapore dollar which is heavily influenced by the banking system in that they finance a much of the major Asian construction projects.
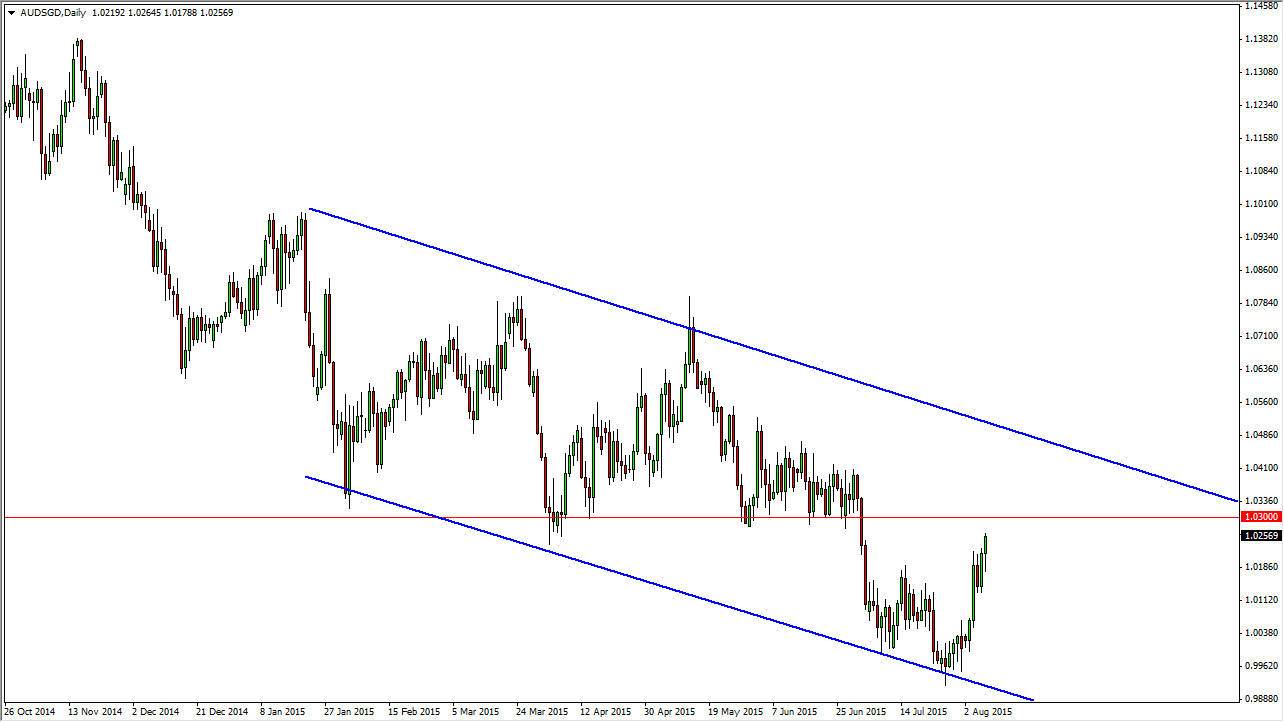
We all know that the Asian economies are slowing down, and as a result this is simply a matter of “who’s getting hurt worse.” At this point in time, the Australian dollar has seen a little bit of a reprieve, and that’s not too surprising considering it has bounced against the US dollar. However, when I look at this chart I see obvious resistance just above in the form of the red line I have on this chart at the 1.03 handle.
Selling resistance
If I see some type of resistive candle around the 1.03 level, I would be more than willing to sell. You can see that before broke down the 1.03 level, we had a pretty significant consolidative area, and then finally broke down. We have not tested that area for resistance yet, which is something quite common to happen. With that, I think that’s all we’re doing in this is essentially a “technical bounce.”
I will wait to see what forms on the daily charts, but I am not going to hesitate at all to start selling. On top of all that though, you can see that I have a little bit of a daily downward channel drawn on this chart as well, although to be honest it is a little bit fudged and isn’t quite perfect. However, it gives you a general idea of where we're going. With this, I remain bearish and even though I’ve seen a really strong bounce in this pair, I have to assume that the trend is going to continue and therefore I look at this as value in the Singapore dollar.


