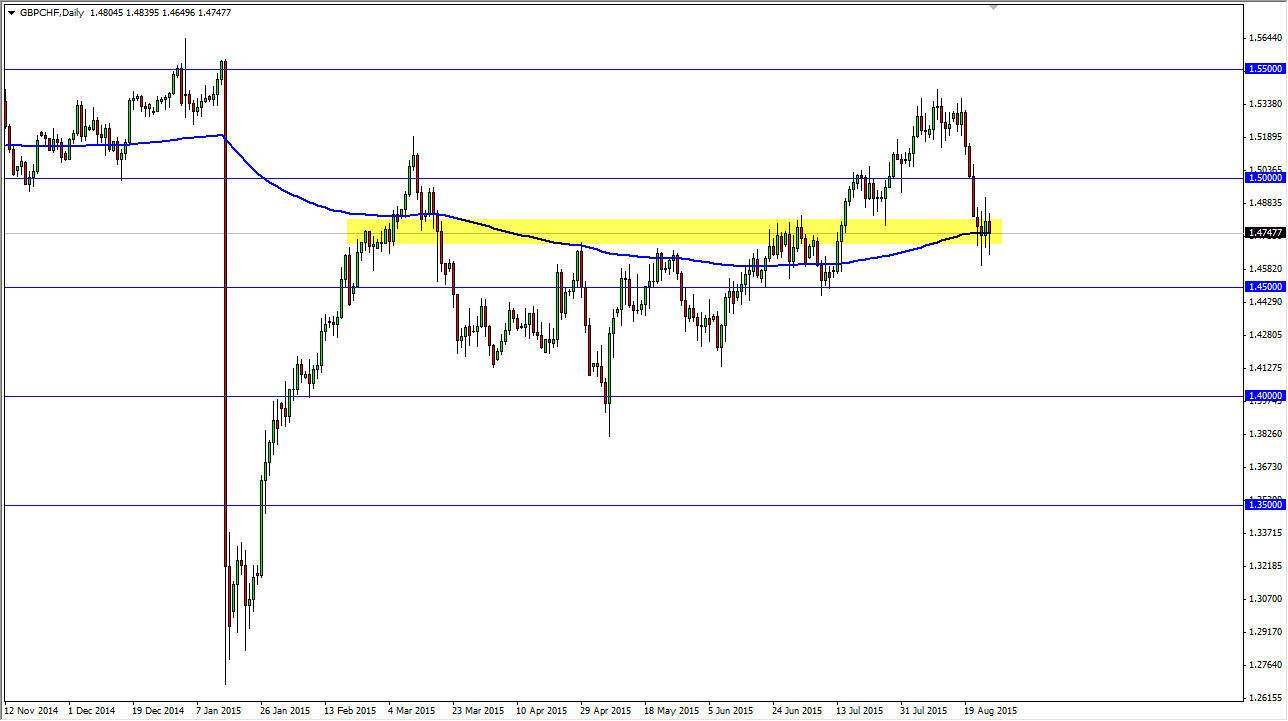
The GBP/CHF pair has been going sideways for the last couple of sessions, and while that normally wouldn’t catch my attention I cannot help but notice that the 200 day exponential moving average is sitting right where we are. This is a long-term trader’s type of indicator, as it is a throwback to the old Wall Street days of technical analysis. After all, 200 trading days is what you have per year, so a lot of the big firms tend to pay attention to this particular moving average. (Yes, I understand that there are more than 200 days in the Forex world, as we have 5 ½ trading sessions per week. However, a lot of long-term technicians use the old standards.)
With this being said, you can also make an argument for a considerable amount of support at the 1.47 level as indicated by the yellow box. This is an area that was resistive previously and we have now come back to retest that area. It is because of this that I am watching this pair as well.
Risk aversion, risk appetite
This is an easy pair trade when the conditions are correct. It comes down to risk aversion or risk appetite. As risk appetite increases, this pair tends to do the same. On the other hand, if risk aversion comes into focus, this pair tends to fall. The fact that we are bouncing around at this moment in time tells me that the market is simply trying to weigh its options. I think that if the stock markets can find some type of support, that should push this pair higher given enough time. I think that this pair will move rapidly in one direction or the other once we get all of the liquidity back in the marketplace. With this, an impulsive move to the upside would be perfect, as it would show a bounce off of the 200 day exponential moving average. On the other hand, if we get an impulsive red candle, that means this pair is probably going to fall apart rather rapidly as it tends to do. Keep an eye on this market, and follow whichever impulsive daily candle forms next.


