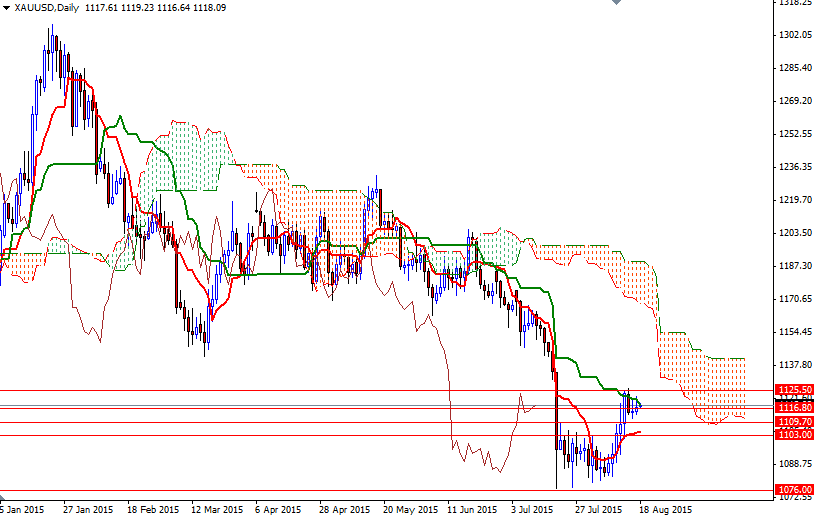
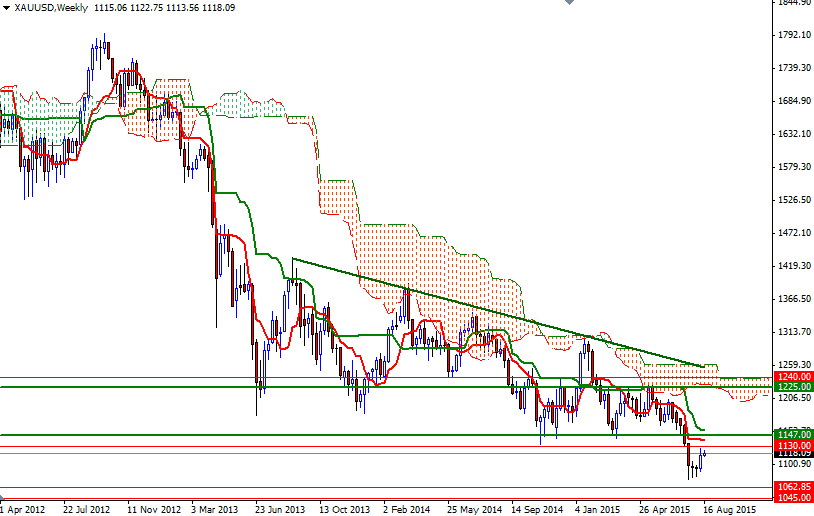
Gold prices edged slightly higher on Monday, helped by weaker-than-anticipated U.S. manufacturing data and concerns over the implications of China's currency devaluation, ending the day at $1117.31 an ounce. The XAU/USD pair traded as high as $1122.75 after the New York Federal Reserve Bank reported that the Empire State manufacturing index dropped to -14.9 from 3.9 a month earlier, but gave up some of its gains following upbeat housing data. It seems that gold will be supported (or tend toward consolidation between 1109 and 1226) over the near term while markets continue to feel the repercussions of Beijing's new measures, though the primary driver of gold prices in coming days will be the minutes from the Fed's July meeting.
From a technical point of view, the short term outlook is bullish while the XAU/USD pair is trading above the Ichimoku cloud on the 4-hour time frame, plus the Tenkan-Sen (nine-period moving average, red line) and the Kijun-Sen (twenty six-period moving average, green line) lines are positively aligned. However, beware that the bulls will be having a hard time gaining significant momentum over the long term while prices are moving below the daily and weekly Ichimoku clouds define the major resistance zones.
As I mentioned in my previous analysis, the area between 1147 and 1130 had served as a floor in the past so now it should act as good resistance. In other words, any spikes up to these strategic levels could provide a shorting opportunity. In order to climb that far the bulls will have to clear the resistance at 1126. The initial support level stands at 1116.80, followed by 1112.80. If the bears increase the downward pressure and this support (1112.80) is broken, then the next stop will be the 1109 - 1103 zone which is occupied by the cloud on the 4-hour chart.


