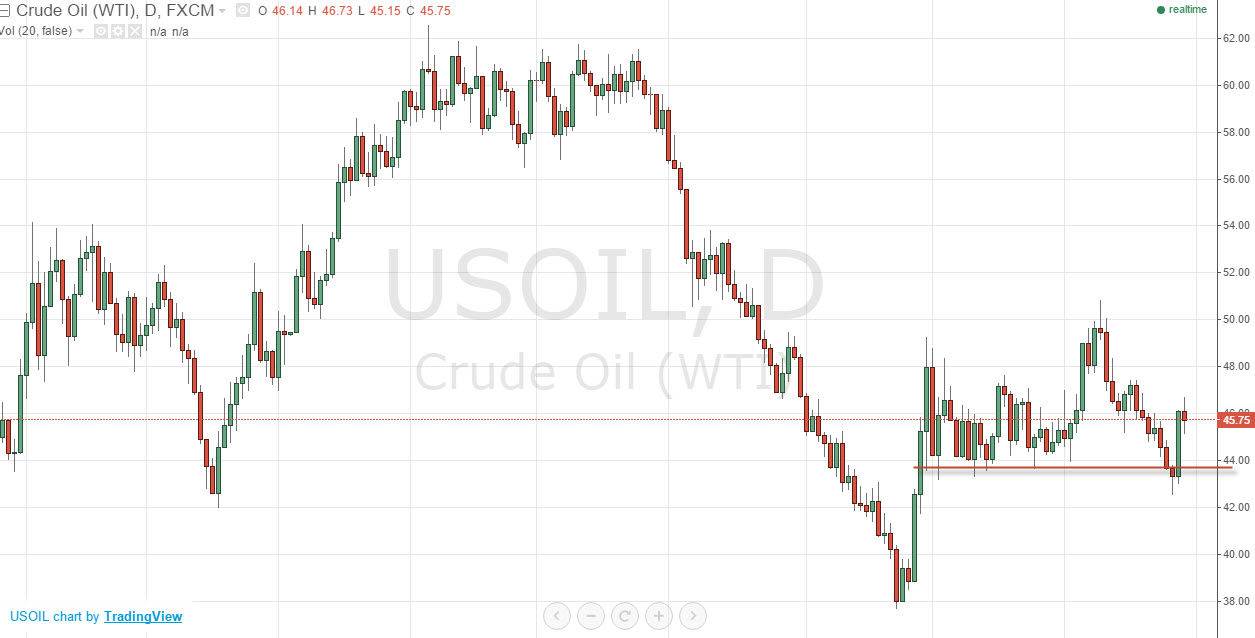
Looking at the WTI Crude Oil market, you can see that we went back and forth during the course of the session on Thursday. This was preceded by a massively bullish candle on Wednesday, and a hammer on Tuesday. This brings up several interesting questions and thoughts at this point in time. After all, the candle looks very neutral and as a result I believe that it’s easy to think that perhaps we will fall from here as the buyers may have been completely exhausted.
The first opportunity would be a break down below the bottom of the neutral candle for Thursday as it would allow us to start selling again and reach towards the $44 level. However, a break above the top of that candle is a very bullish sign, and should send this market looking towards the $48 level, which was the top of the previous consolidation region.
Lots of volatility
The only thing that I can see clearly is that there will be a lot of volatility. With this, I feel that trading the market due to the breaking of the candle in one direction or the other is the only way to be involved. However, I would choose to do it on short-term charts. I believe that if we break above the top of the candle for the day on Thursday, perhaps looking for buying opportunities off the 15 minute chart will be the way to go. On the other hand, if we break down below the bottom of that I think 15 minute charts will allow shorting opportunities as well.
Ultimately, this is a market that will continue to be very choppy, but the way that we jumped straight up in the air after breaking down the other day, shows that we are in fact going to struggle to break it down completely. In other words, we may have still seen the bottom, even though just a couple of sessions ago it look like a massive supportive level had been smashed. Stick to the short-term charts, or better yet, use binary options if you have the ability.


