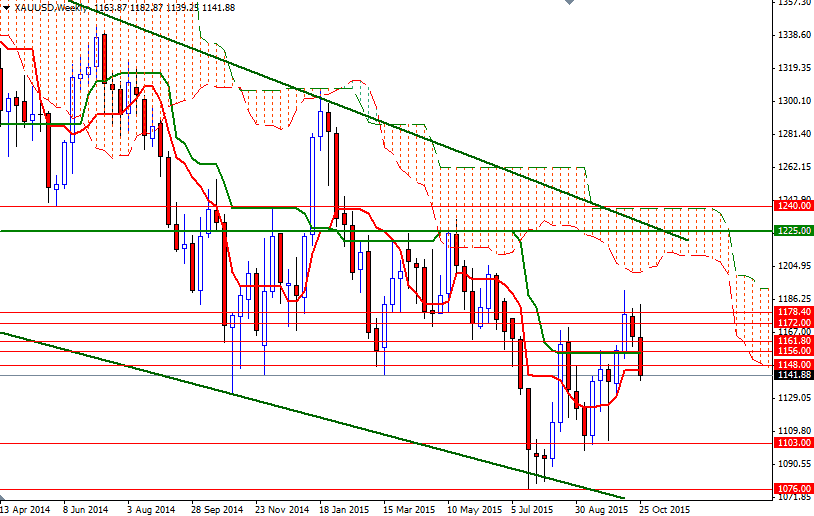
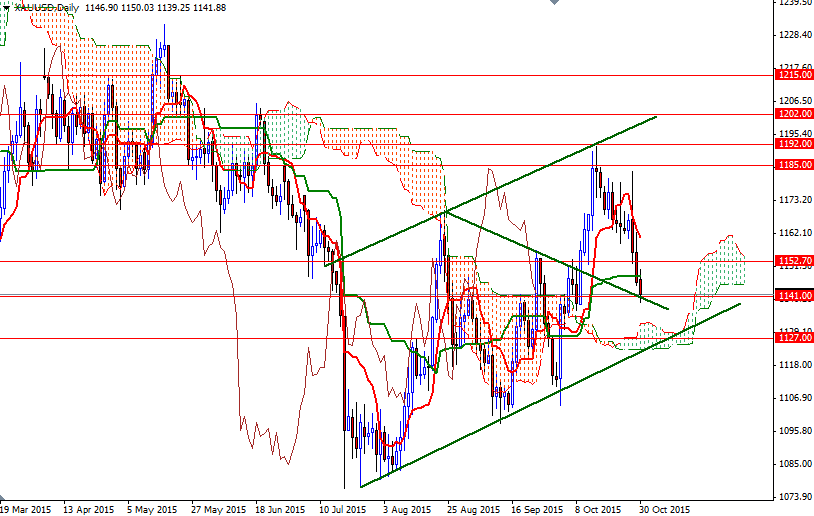
Gold prices fell for a second consecutive week but still ended the month with a gain of nearly 2.5%. The precious metal initially got benefit from a soft dollar, which was hurt by bleak economic data, but encountered a solid resistance around the $1192 level and showed signs of exhaustion. The market dropped all the way to the $1141 after the Federal Reserve sent a signal on the possibility of a rate hike in December. In its latest statement, the Federal Open Market Committee (FOMC) said "In determining whether it will be appropriate to raise the target range at its next meeting, the committee will assess progress - both realized and expected - toward its objectives of maximum employment and 2 percent inflation".
What caught markets off guard was the tone of the statement which dropped warnings over emerging market malaise. However, the month ahead may get off to a slow start, with market participants sitting on the sidelines ahead of the key economic releases. The highlight of the week will come on Friday when the Labor Department releases its employment report for October. Another lackluster report might increases the chances that the central bank will delay the implementation of rate hikes into 2016. On the other hand, if fresh data give the Fed enough confidence that the economy is ready to endure higher rates, gold may come under fresh selling pressure.
Technically speaking, the weekly and 4-hourly charts are bearish while the pair is trading below the Ichimoku cloud. We also have bearish Tenkan-Sen (nine-period moving average, red line) - Kijun-Sen (twenty six-day moving average, green line) crosses almost on both time frames. If the XAU/USD pair drops below the 1141/38 support down below, then the market will have a tendency to fall further towards the 1127/3 region where the daily cloud, a horizontal support and the bottom the ascending channel cluster. This area should give powerful support if prices return there. Conversely a strong break below the cloud might lead to a sharp fall down to 1113/0. Once below 1110, there will be little to slow this pair down until we reach the next key support at the 1103/0 level. To the upside, there are hurdles such as 1148 and 1156 but I think clearing the resistance at 1161.80 is essential if the bulls want to win the battle expand their grounds. Since that would put the daily and 4-hourly charts in the same direction, it is technically possible to see a bullish continuation targeting the 1185 and 1192 levels. Climbing above this barrier could signal a run up to 1202 or higher(1215).


