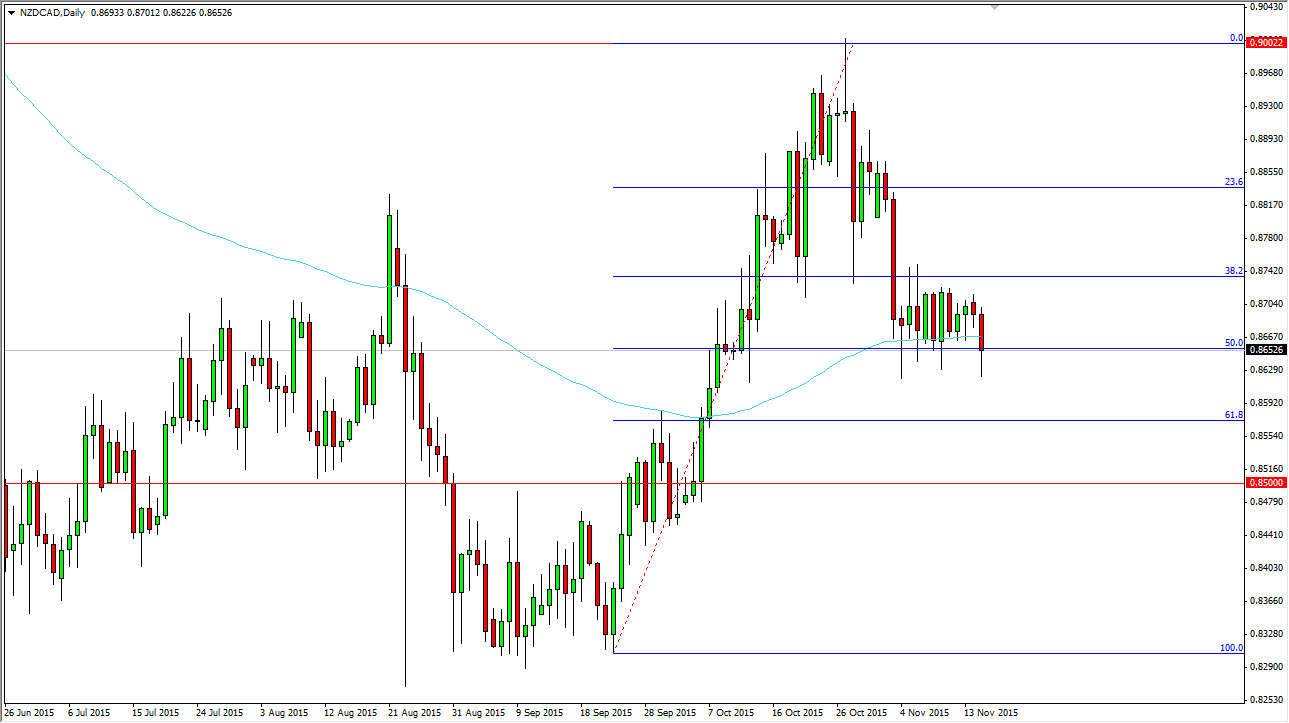
The NZD/USD pair fell during the day on Monday at again, but just as we have seen for several sessions in a row, there had been buyers towards the end of the day that turned the market back around. Looking at this chart, you can see that I have attached a Fibonacci retracement level tool on the screen, and it currently shows the trading area that we are involved in as the 50% Fibonacci retracement level. This of course is one of the most important Fibonacci retracement levels that you can find in a chart, and as a result it looks as if the buyers will continue to support this market.
On top of that, you have the 100 day exponential moving average in this general vicinity, and as a result I believe that some longer-term traders are starting to look to pick up this pullback that we have seen from an explosive move higher. You can also see that the top of the range recently had reached towards the 0.90 handle, but then formed a massive shooting star. The shooting star of course is a negative sign, but it shows that perhaps we just ran out of momentum.
Commodity Currency versus Commodity Currency
At this point in time, you have to keep in mind that both of these are commodity currencies, but Canada is thought of as a proxy for oil more than anything else. The New Zealand dollar is more or less going to be a proxy for the overall attitude of commodity markets in general, so having said that you could get quite a bit of volatility due to the fact that pretty much everything commodity related is in serious trouble.
With this, if we can break above the 0.8750 level, I feel a market will then break out towards the 0.90 handle again. On the other hand, if we break down below the bottom of the range for the session on Monday, it is likely that we will reach down to the 0.8575 level which is the 61.8% Fibonacci retracement level.


