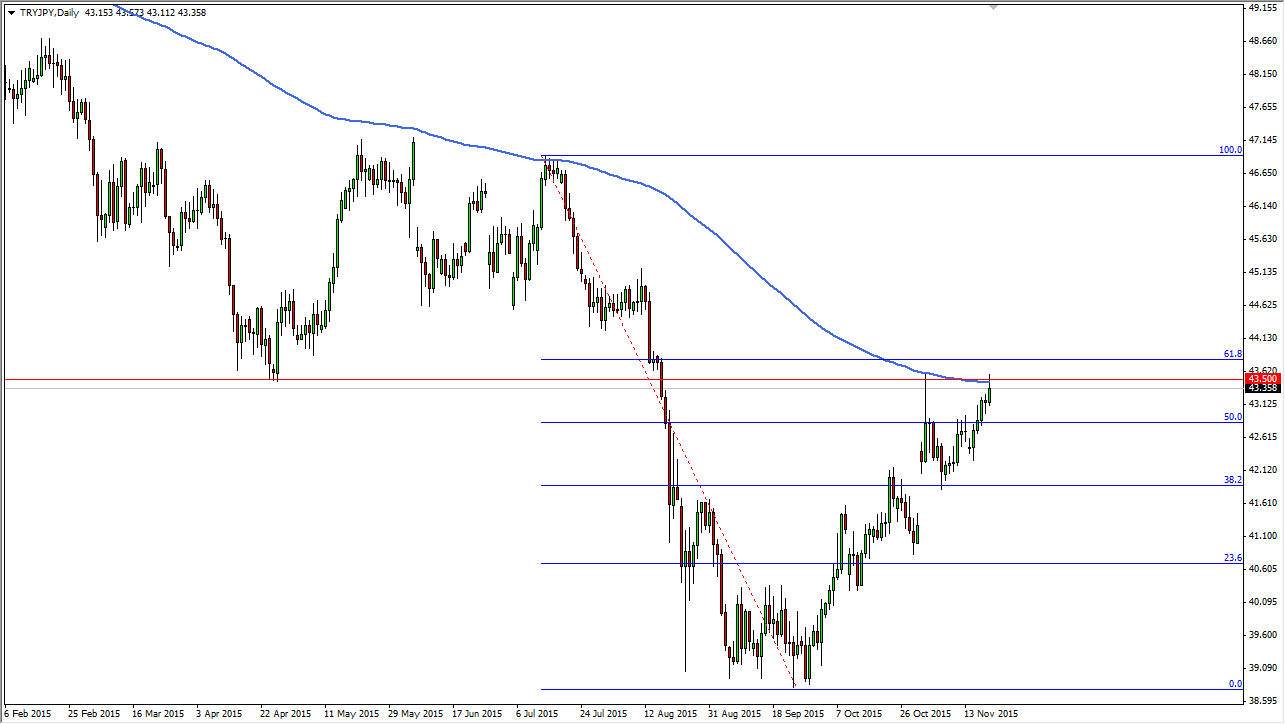
The TRY/JPY pair broke higher during the session on Friday initially, but as you can see struggled at the 43.50 level. This is a pair that I look at yesterday, and as a result I am not surprised that the resistance showed itself at this level. After all, when you look at the chart, you can see that the 61.8% Fibonacci retracement level is just above and that of course is resistive. On top of that, you can see the red line shows clearly where we have seen support and resistance in the past.
The candle that formed for the Friday session is a bit like a shooting star, so it tells me that more than likely the sellers are starting to step into this marketplace. We also have the 200 day exponential moving average just above, so there’s a lot here to ponder. After all, you have to look at the markets at a macro sense, as the Turkish lira is considered to be a “risky” currency. This is especially true with the conflicts going on next door, so it makes a lot of sense that perhaps the Japanese yen is a much more trusted currency at the moment.
Major Area
I believe that this is a massive area as far as this market is concerned. I think that if we break down below here, it’s very likely that the market should reach towards the bottom of the gap that had formed a few weeks ago, and with this we feel it’s only a matter of time before the market tries to fill that gap. Also, you have to keep in mind that any type of negativity should work against this currency pair.
On the other hand though, if we do break above the 61.8% Fibonacci retracement level at roughly 44, this market should continue to go much higher, perhaps reaching towards the 100% Fibonacci retracement level which is currently at the 47 handle. Because of this, I believe that this is a pair you should pay attention to as we should get a longer-term move soon.

