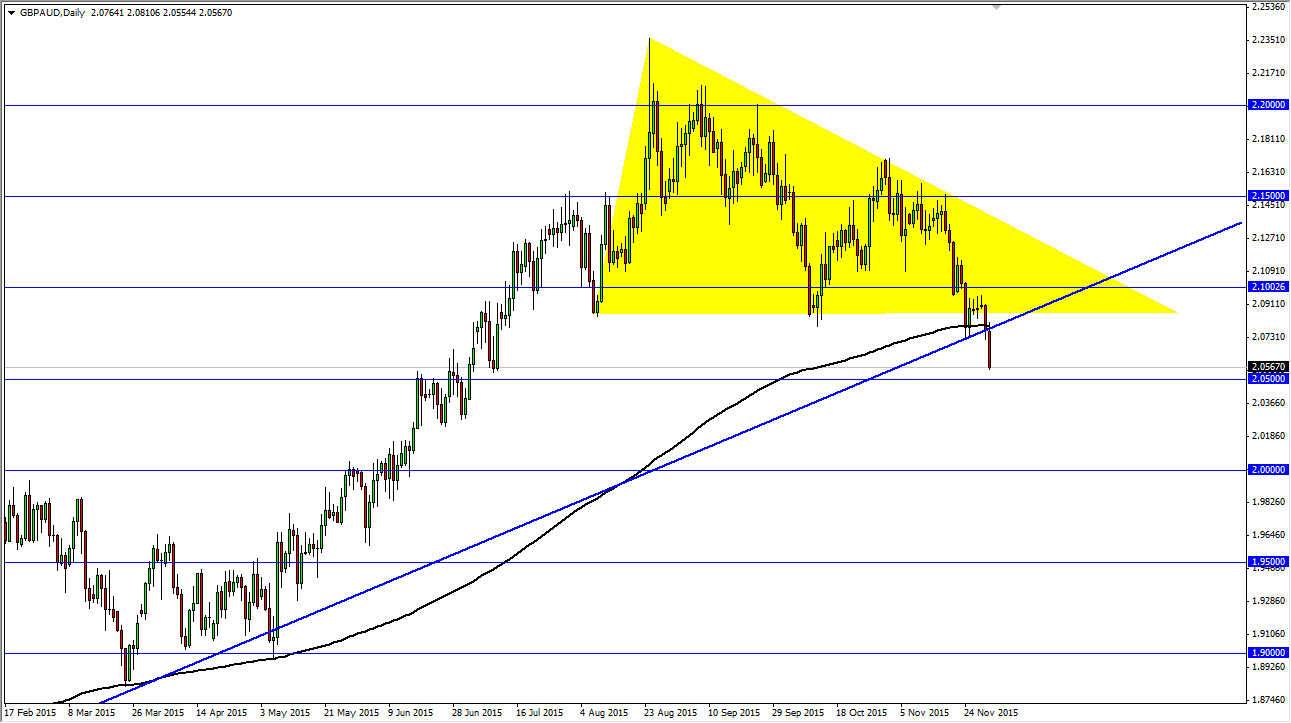
The GBP/AUD pair initially tried to rally during the day on Tuesday, but gained very little before turning back around and falling significantly. On this chart, I have several different things marked, and I believe that this is one of the more interesting trades out there at the moment. After all, both currencies are fairly soft, but the Australian dollar has seen a bit of a reprieve lately, even against the US dollar. Ultimately, the market looks as if the British pound is struggling concurrently, so it makes sense that we would continue to go lower.
Several Indicators for Downward Motion
We’ve recently crossed below the 200 day exponential moving average, and as you can see it has acted as support previously during the months of both March and May. This is a long-term trader’s type of signal, and with this I believe that a lot of money has just entered the market on the short side. We’ve also broken down below the longer-term uptrend line, and as a result I feel that a lot of people are starting to get nervous.
On this chart, I have marked a yellow triangle, which of course is a descending triangle. When you measure the height of the descending triangle, it is roughly 1300 pips. That should send this market looking for roughly 1.96 or so, and as a result I think we have quite a ways to go to the downside.
Beyond that, we closed at the very lows of the range. The normally means continuation, so having said that I feel that any time we rally at this point in time should be a selling opportunity. I recognize the 2.05 level below could be supportive, but I think it will be short-term support at best. I believe that we have just witnessed a trend change, and fully anticipate taking quite a bit of advantage when it comes to selling opportunities.

