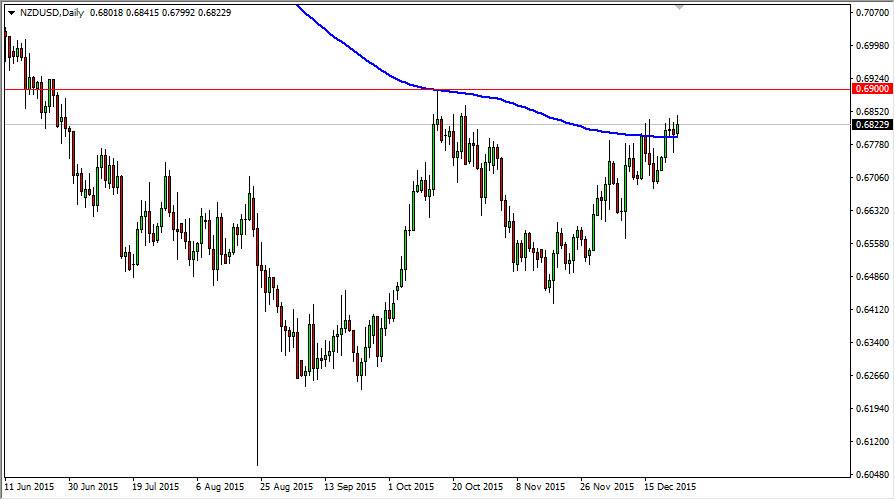
The NZD/USD pair had a slightly positive session on Thursday, as we now find ourselves above the 200 day exponential moving average. That of course is a massive trading signal for long-term traders, as it essentially gives us the average of the market over the last year.
Quite often, the 200 day exponential moving average is used to determine the trend. Ultimately, longer-term traders will enter the market on either side and hang onto positions for a very long time. It is possible that we are starting to see here, and as a result this is an area that is very important as far as I can see. On top of that, the 0.69 level above has been resistive in the recent past. Because of this, I think if we can break above the 0.69 level, longer-term traders will really start to get into this marketplace as we have cleared the 200 day exponential moving average, and of course that important price level.
Commodities
What we find interesting about this chart is that it goes against what we are starting to see in commodity markets. Some commodities are rallying sure, but at the end of the day they really aren’t that strong. Perhaps this is an interest-rate differential play, as there is very little place that traders can go in order to pick up positive interest, and perhaps that could be part of it. However, I think that the next week or 2 might be a bit choppy, so at best I think you are looking for short-term trading opportunities.
By sticking to short-term charts, you can play this vital area but once we get above the .69 level, I feel that you have to start thinking more along the lines of daily charts, perhaps even weekly charts because this could be a huge sea change of attitude in this market. With the positive swap, you could get paid quite nicely over the longer term. On the other hand, a very resistive or exhaustive candle near the 0.69 level might be reason enough to start selling again.


