Every day, four days per week, I publish daily signals / forecasts for the seven most important Forex pairs: the USD paired with the EUR, GBP, CHF, JPY, AUD, and NZD.
As I am eager to help developing traders, and cannot update the signals once I have published them, I use the safest method that I can to develop the forecast – I identify and highlight zones of support and resistance where the price has a good chance of turning quickly. A reader who takes note of the zones and watches to see if the price turns if and when it gets there, has a good chance to enter a low risk, high reward profitable trade.
It is up to the reader to watch what the price does when it gets to these zones. In my opinion, the best method is usually to watch the hourly chart and what for a classic “reversal” candle to close, such as a pin bar, a doji, an outside or even just an engulfing candle with a higher close. You can exploit these levels or zones by watching the price action that occurs at the given levels.
I also suggest moving any trade’s stop loss to break even when it is around 20 or 25 pips in profit (20 pips in the case of the AUD / USD pair), not because this is the most profitable way to trade, but because it is safe in protecting capital as much as possible. However this necessarily limits some trades which eventually turn out to be great runners.
Regular readers will know from their own experience that the support and resistance levels I give are accurate more often than not, and can be exploited profitably by traders. I’m not going to go over all the thousand plus forecasts I made during 2015, but below I will look at how these signals performed over the past 3 months with a single currency pair. I chose the AUD / USD for the simple reason that it was first in the alphabet, although it has also been an interesting pair to trade that is overlooked by too many traders especially those in western time zones.
AUD/USD Signals Review 4th Quarter 2015
During the final three months of the year of 2015, my published daily signals / forecasts for AUD/USD would have given 17 trades to anyone following them. It is true that on an average day, my forecasts do not usually give a trade, because it is better to be safe and sorry. It is better to trade one pair 5 times per month and come out ahead than to trade it every day and lose overall. Overtrading is a mistake made by too many traders.
Of these 17 trades, if they had been taken in line with the methodology of waiting for suitable hourly price action off the identified levels as reversals, 5 were sizable wins, 6 were small wins, 1 broke even and there were 4 losing trades. This was a quite good record – unquestionably profitable - and probably slightly better than the performance for most of the other currency pairs, although I am certain that overall all the pairs together also had a profitable record.
Trade Highlights
One of the easiest ways to become a more profitable trader is to take only partial profits on winning trades that are in line with the wider trend – if there is one – and leave some of the position to run. Let’s look at a couple of the best AUD/USD trades and see if there is anything we can learn from them.
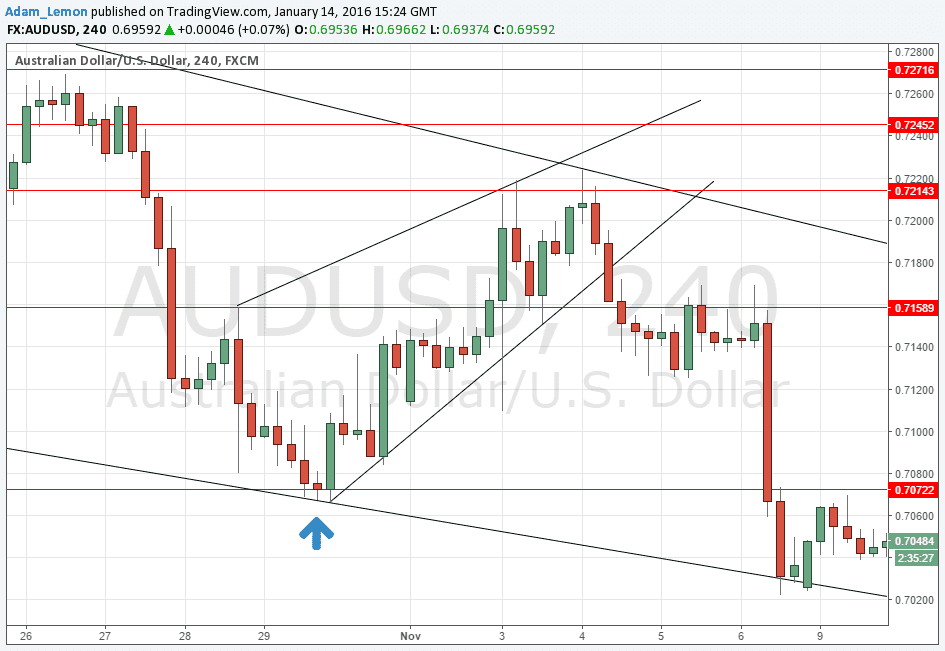
29th October, 2015
This day I suggested looking for a long off a bullish bounce from the anticipated support at 0.7072. This level worked very well as support and in fact is still in use as a crucial level on my charts today. You can see that the price turned right off the level and rose a maximum of 150 pips:
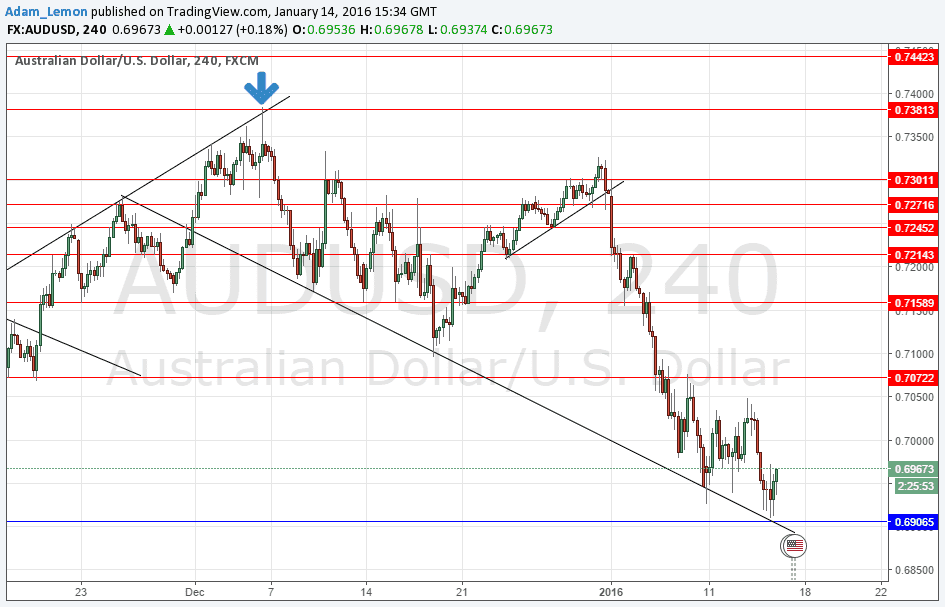
3rd December, 2015
This day I suggested looking for a short off a bearish bounce from the anticipated resistance at 0.7380. This level worked very well as resistance, although the bounce actually happened the next day when I published no forecast. However it is still the highest price of recent months almost to the pip, and has held to this day! The price has subsequently fallen more than 470 pips in total from that price, and shows every sign of falling further as the pair is in a strong downwards trend and close to making a new multi-year low price. This just shows how profitable it can be if you show some patience and let at least some profit run for weeks or even months.
How I Draw Horizontal Support & Resistance Levels
It takes some practice but it is not rocket science. Just pull up a long-term candlestick chart for a currency pair and look at the higher time frames such as H4 and D1. Now try to identify the horizontal levels that have held as both support and resistance, where the moves crossing the line have been quite strong and fast. This is how I identify most of the levels that I use in these forecasts and you can try it too.
In the meantime I encourage you to follow my signals as they are quite accurate and can help you find profits. Likewise, I encourage you to leave comments or questions in the comment section below or to contact me via twitter at @DailyForex so that I can help clarify any issues.


