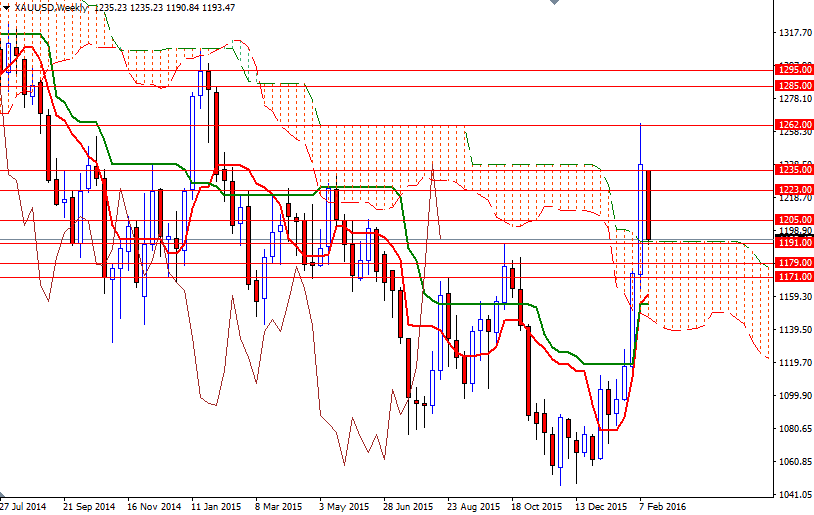
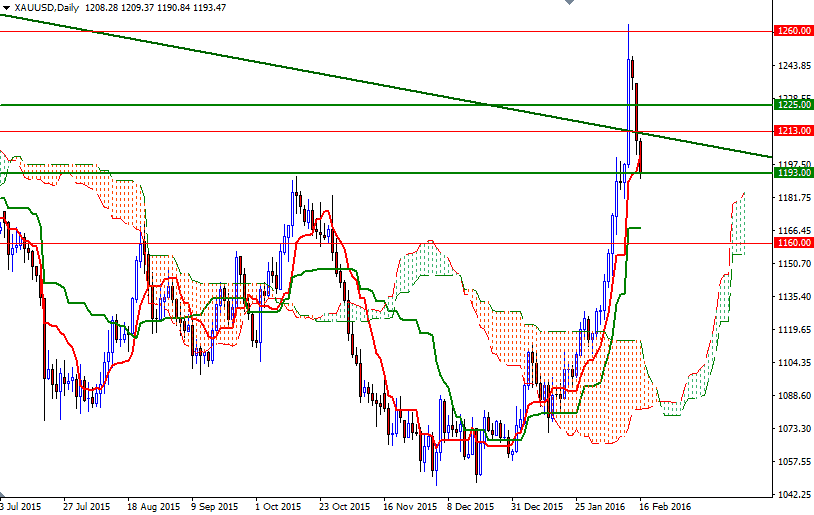
Gold prices gapped lower on Monday as signs of stabilization in stock markets sapped demand for the metal as an alternative investment. While major equity markets reversed some of the steep losses witnessed last week, gains in the dollar and also made gold less attractive. On Thursday, the XAU/USD pair hit the highest level in a year but after climbing sharply, we saw a lot of selling in the 1260/50 zone. In my previous analysis, I had warned that the candlesticks on the 4-hour chart, with long higher shadows were signs of rejection and the market was due for some kind of correction.
Prices dropped further during today's Asian session on technical selling as closing below the 1213 level put extra pressure on the market. As a result, the XAU/USD pair reached the 1193/1 area where the top of the weekly Ichimoku cloud sits. These clouds not only identify the trend but also define support and resistance zones.
In other words, this area is likely to provide some support and might even halt/slow down the fall. If prices turn north from here, the 1200 and 1205 levels will become resistance and bulls will have to push the market beyond that to regain their strength. Closing above 1205 would indicate that the market is getting ready to revisit the 1213 level. If the aforementioned support (1193/1) fails to hold, prices may head back to 1179/60 which is likely to act as an effective support as the clouds on the weekly and 4-hour time frames overlap in that region.


