Gold prices settled at $1222.19 an ounce on Friday, making a gain of 0.49% on the week but suffering a loss of 0.47% over the month. The XAU/USD pair initially moved higher and tested the 1285/0 area but found significant amount of resistance -which then led to long-side profit taking- and reversed its course. As a result, the market printed a shooting star on the monthly chart. The overall positive tone of Federal Open Market Committee members and gains in U.S. stock markets were also among the key factors eroding gold's appeal. Although several members of the committee have suggested they should continue to raise rates, Fed Chair Yellen eased markets' concerns saying it would be appropriate for policymakers to proceed cautiously in adjusting policy given the uncertain economic outlook.
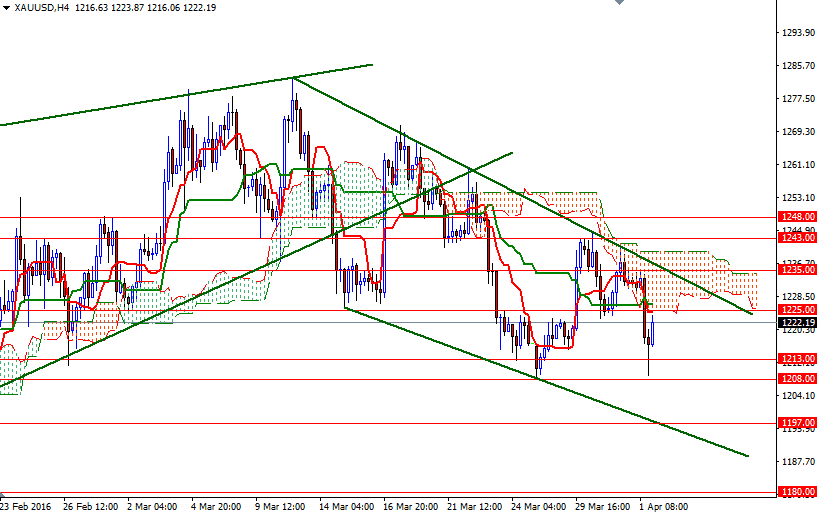
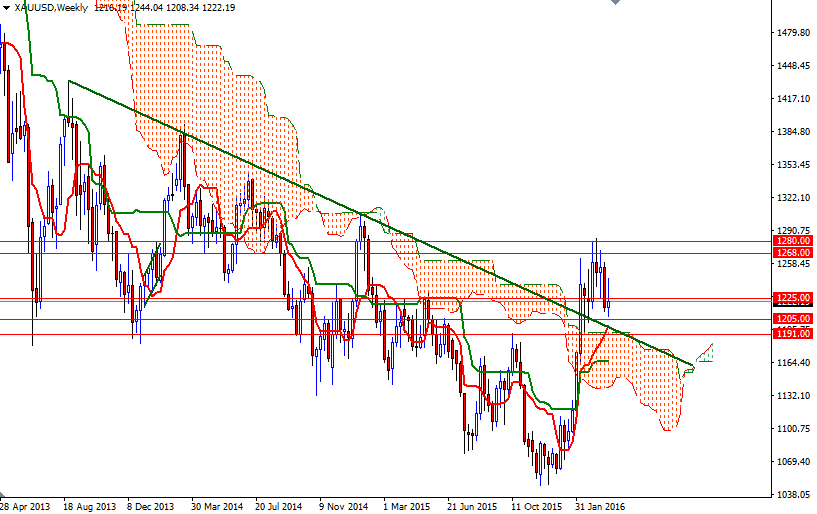
Looking at the charts from a purely technical point of view, the first thing catches my attention is the weak technical outlook on the 4-hour chart. The market has been trading below the 4-hourly clouds since price broke out of a bearish wedge formation (and failed an attempt to climb back above the cloud). We also have negative Tenkan-Sen (nine-period moving average, red line) - (twenty six-day moving average, green line) crosses on both the daily and 4-hour time frames. These, along with the long upper shadow of the monthly canle, make me think that downside risks will remain and prices will have a tendency to retreat towards the daily and weekly clouds before the market reverses.
Beware that the clouds on the weekly and daily charts overlap in the 1191 and 1177 region. This area should provide strong support if the markets return there. In order to reach that area, the bears will need to pull the market below the 1208/5 support. If the fall doesn't halt at 1191, the 1180 level could be the next stop. If the bulls intend to regain their strength and take over the control, first they have to push prices beyond the 4-hourly cloud which occupies the area between the 1225 and 1243 levels. A sustained break above 1243 could put us back on track with such a scenario eying subsequent targets at 1248, 1272/68 and 1285/0.


