Gold prices ended Monday's session up $18.35 as market participants continued to adjust to the U.S. Federal Reserve’s cautious plans for raising interest rates. The minutes of the Fed’s March 15-16 meeting released Wednesday revealed that policymakers showed concern about downside risks to the economic outlook stemming from overseas. Also a slide in equities made gold more attractive as an alternative asset.
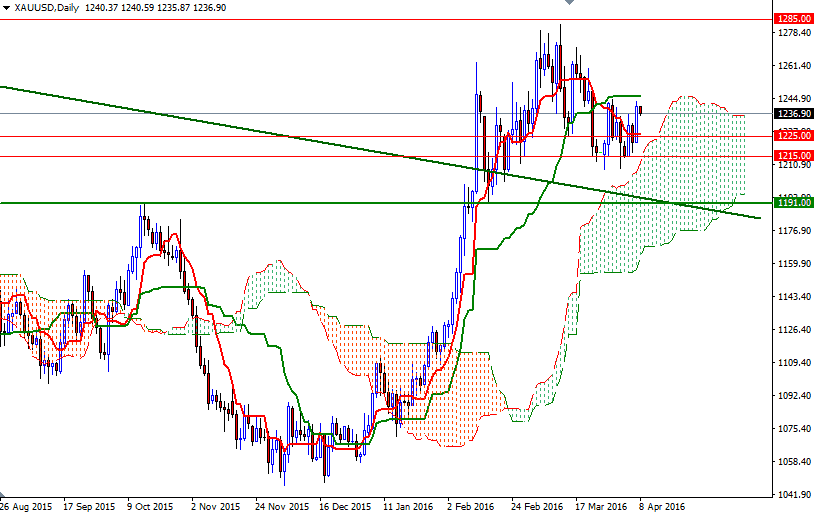
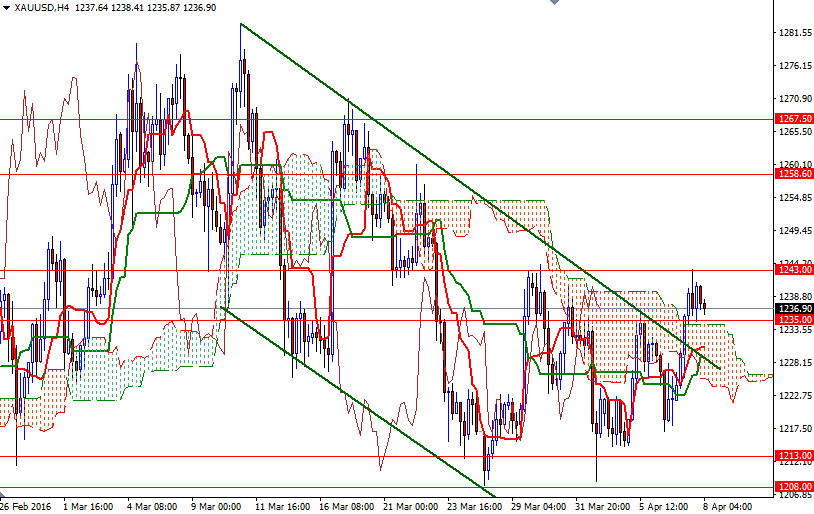
The XAU/USD is currently trading at $1236.90 an ounce, slightly lower than the opening price of $1240.37. The market challenged the $1243 level as expected after prices climbed above the $1235 resistance level but failed to break through. As a result, prices are consolidating between these two levels. Speaking strictly based on the charts, trading above the Ichimoku cloud on the 4-hour chart improves the technical picture as it realign short-term charts with longer-term bullish inclinations.
However, the potential upside is likely to be limited until the 1245.58-1243 resistance is convincingly broken. A sustained break above the 1245.58, which happens to be the daily Kijun-sen (twenty six-period moving average, green line), could pave the way towards the 1255-1258.60 region. If the bears intend to increase the pressure, they will need to pull prices back below the 1235/4 area where the top of the 4-hourly Ichimoku cloud sits. In that case, they may find a chance to make an assault on the 1228.50-1225 support.


