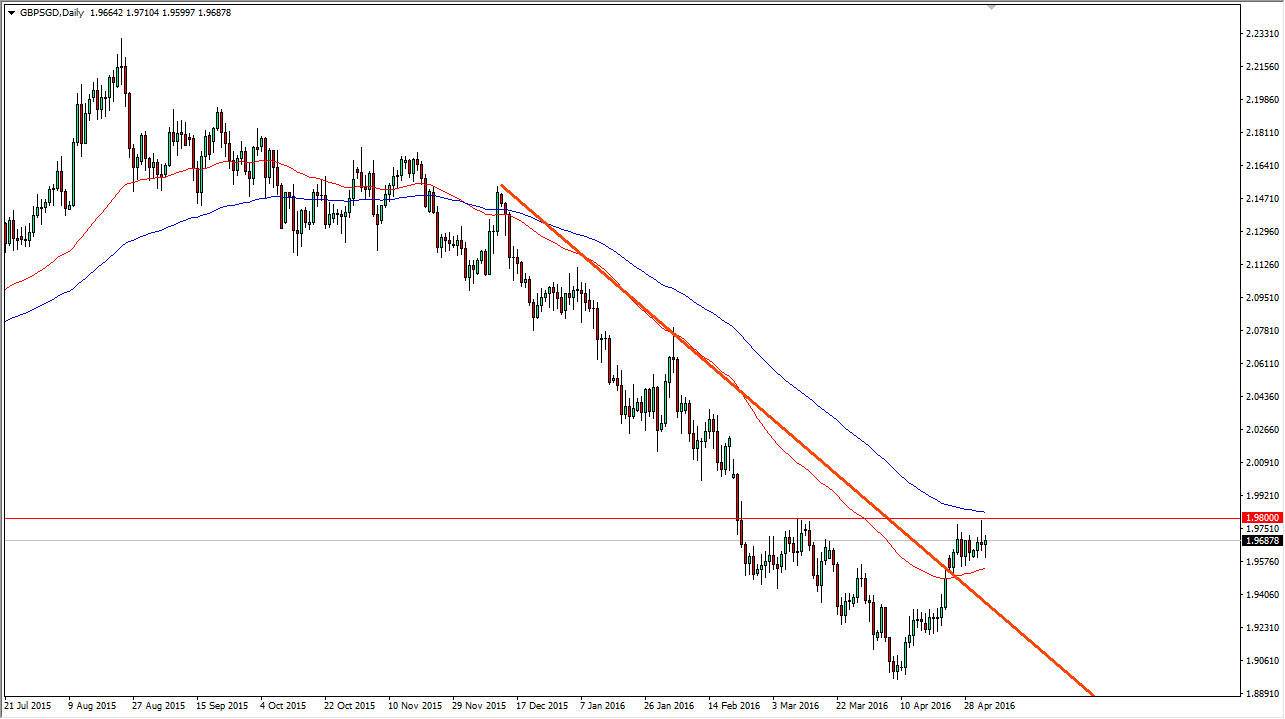
The GBP/SGD pair initially fell during the course of the day on Wednesday, but we turn right back around to form a hammer. This is interesting considering that we had formed a shooting star on the previous session, and in my estimation it looks as if the 1.98 level is very resistive above.
While many of you probably don’t trade the British pound against the Singapore dollar, the reality is that both of these currencies are of a very distinct function with Asian traders. Quite often Asian traders prefer the British pound as a bit of a “risk asset”, and the Singapore dollar as a bit of a “safety currency” when it comes to that region of the world. With this, the market could very well be following risk appetite overall.
Possible breakout
With this, I look at this chart and I recognize that we do have a little bit of an inverse head and shoulders going on right now with the neckline been at the 1.98 handle. I also have a downtrend line that has been broken and now we are simply going sideways. That often will happen before move higher. I also have the 50 day exponential moving average (red) on the chart, as well as the 100 day exponential moving average (blue). As you can tell, the moving averages are starting to turn up a little bit, suggesting that the momentum is starting to favor the buyers overall.
Looking at this chart, it is a bit of an early indication that perhaps we are starting to see the buyers take over again. The British pound had been beaten down for some time recently due to the possibility of the United Kingdom believe in the European Union, I think that move has been overplayed at this point. I believe that if we can break above the 1.98 level, this is a market that should continue to go much higher. The first level of course would be the 2.00 level as far as targets are concerned, but quite frankly this could be the beginning of a trend change.

