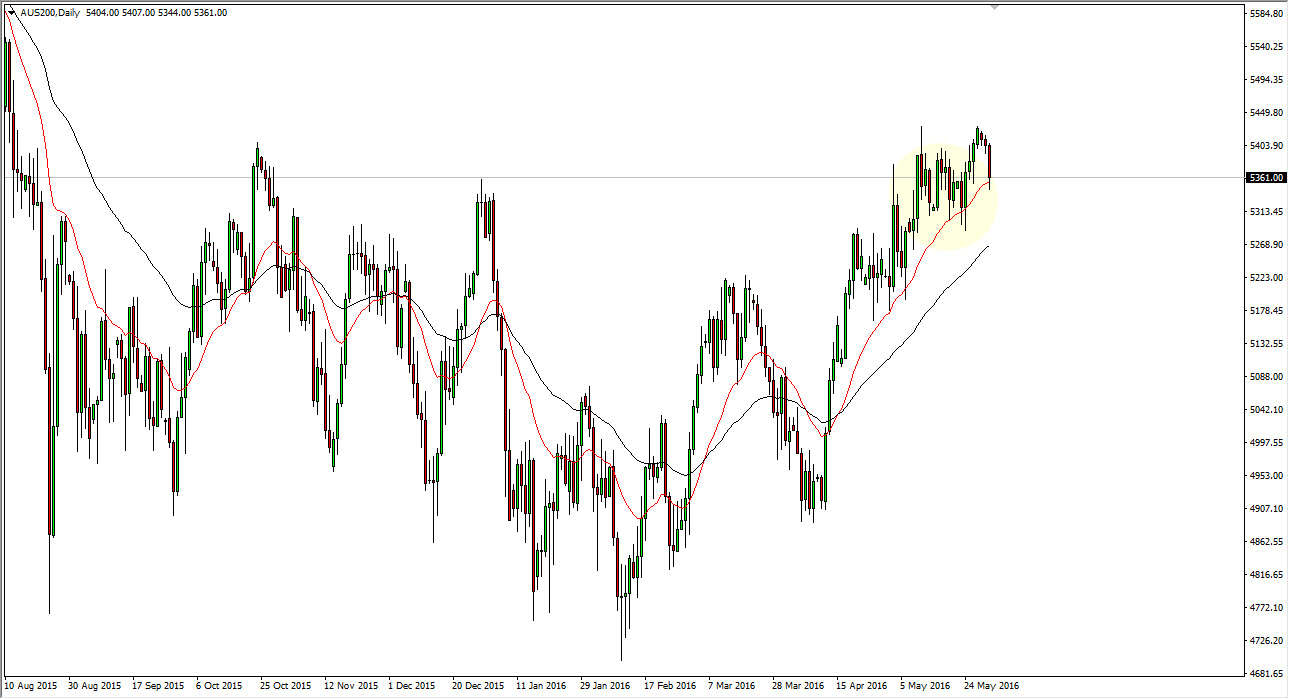
The Australian index fell a bit during the course of the day on Monday, but as you can see I have several things marked on this chart. For starters, I have the red exponential moving average, which is the 20 EMA, and I also have the black EMA on the chart, which is the 50 day EMA. You can see that we are clearly and a long-term uptrend over the last couple of months, and that the 20 EMA has offered quite a bit of dynamic support. The fact that we bounced off their yet again on Monday suggests that the buyers are coming back into this market sooner or later.
Quite a bit of support below
There is a significant amount of support just below, as I have marked it on the chart with a yellow ellipse. With that being the case, I think it’s only a matter time before the supportive candles appear on short-term charts that I can start buying. With this, the market looks as if it is trying to break out above the most recent high, so at this point in time I feel we are simply trying to build up the momentum.
I have no interest in selling this market until we break down below the 20 day exponential moving average, which is quite a way below where we are now. Ultimately, I think the AU$5500 level is a significant resistance barrier, but given enough time I think we will break above there and continue to go even higher. Quite frankly, you have to keep an eye on certain minerals and hard commodities in order to get an idea how and large portion of the ASX200 will be doing as there are so many companies a deal with extraction of elements from the earth. On top of that, gold has been finding support, and as a result it would not surprise me at all to see Australian assets go higher.

