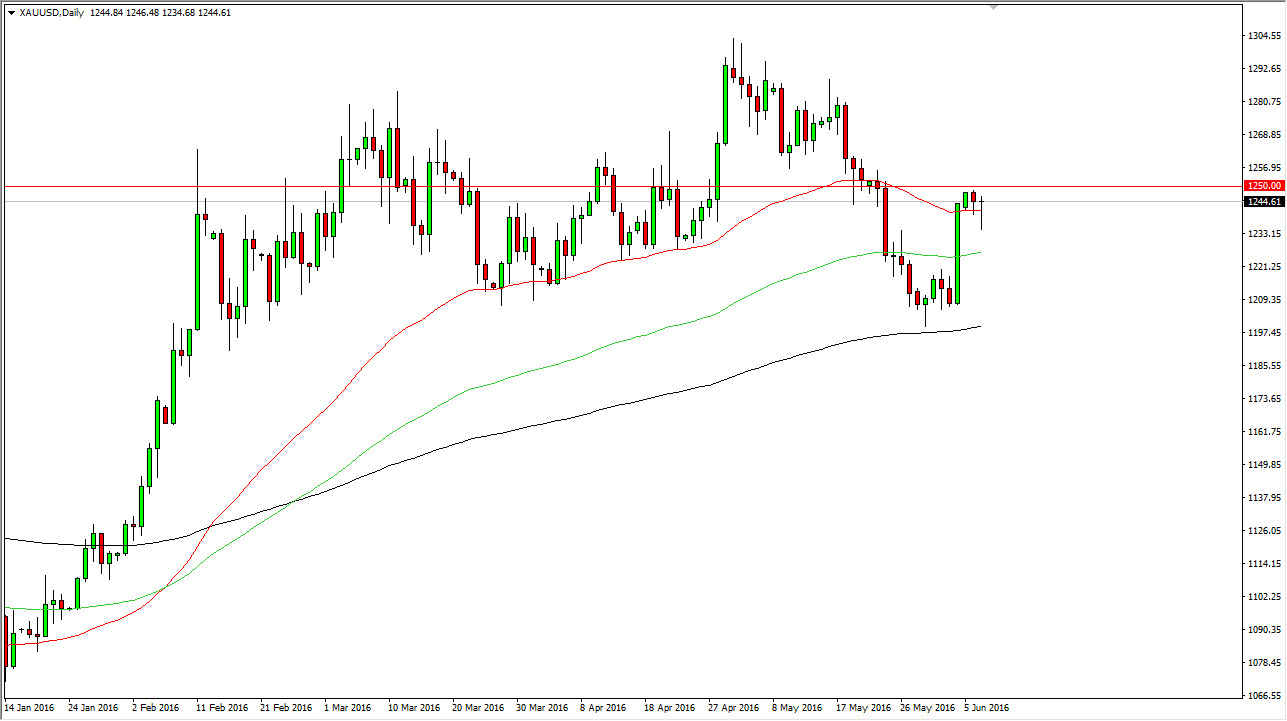
During the day on Tuesday, the gold markets initially fell during the session, but did bounce to show that the $1240 level continues to be quite a bit of support. That support ended up producing a hammer, and that of course is one of the most bullish candlesticks that you will run into. Typically, these show that the sellers are running out of momentum, and that they will soon be overtaken. In this particular market, I see a couple of different things going on that has got me paying attention to the yellow metal.
With this being the case, I look at this chart as signaling a potential move higher. I believe that the $1250 level above is a significant barrier that needs to be broken, but I believe that’s exactly what we are about to start doing. I think that a break above the $1250 level has this market looking for higher levels, perhaps even as high as $1300 given enough time.
Moving averages
I have 3 moving averages plodded on this chart, the 50 day exponential moving average in red, the 100 day exponential moving average in green, and then finally the 200 day exponential moving average in black. You can see that we have a nice spread between the 3 moving averages, and that typically means that the move that has been going on is very healthy. With that being the case, and the fact that we did bounce off the 200 day exponential moving average, I believe that the buyers are very interested in this market at this moment in time.
I believe that a break above the $1050 level is what you will need to wait on in order to buying though, because that area will probably cause a little bit of resistance. However, the fact that we bounced so significantly during the day on Tuesday suggests that it is only a matter of time.

