S&P 500
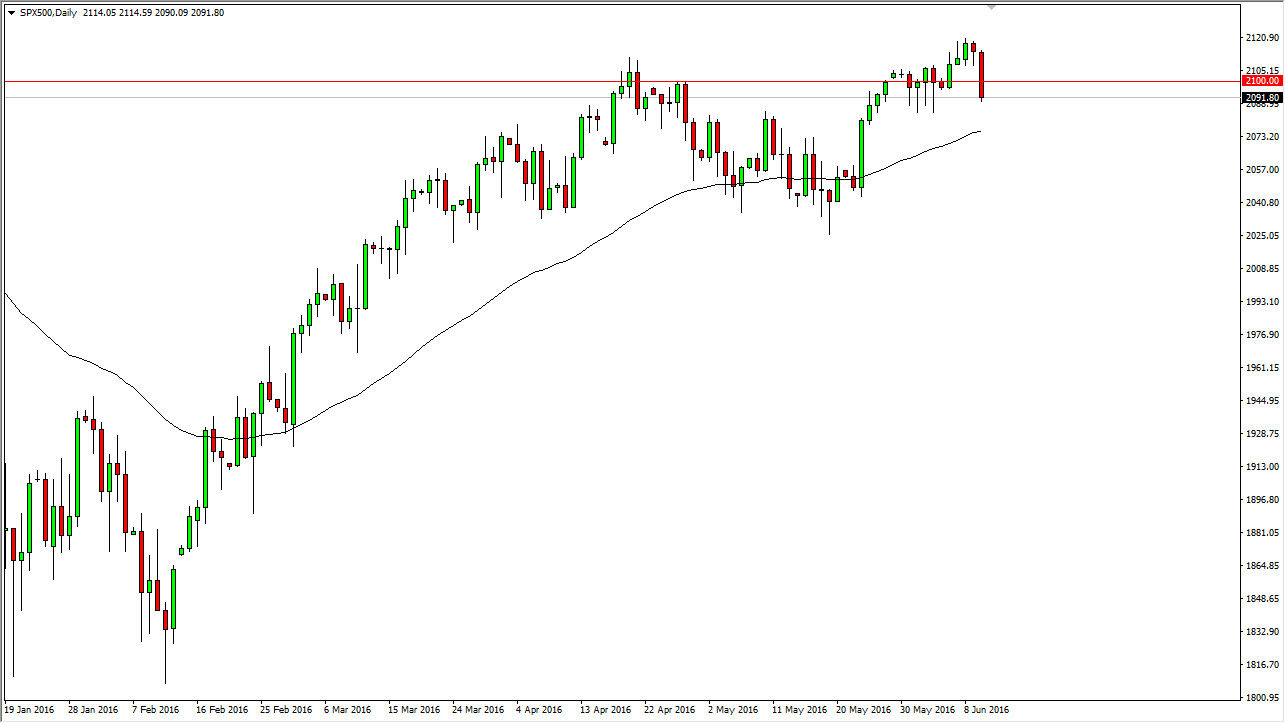
The S&P 500 had a very bad day during the session on Friday as we broke down below the 2100 level. In fact, we are now looking at a market that’s trying to break down below support that is just below the 2090 handle. We also have the 50 day exponential moving average on this chart that has been dynamic support, so having said that it’s likely that the market will find buyers sooner or later but the fact that we ended up forming a candle that closes to the very bottom of the range suggests that we will get a little bit more in the way of continuation. A supportive candle would be reason enough to go long, and as a result that’s what I’m waiting for. On the other hand, if we grind higher and break out to a fresh, new high, that’s also a reason to go long. As far selling is concerned, I’m not quite ready to do so yet.
NASDAQ 100
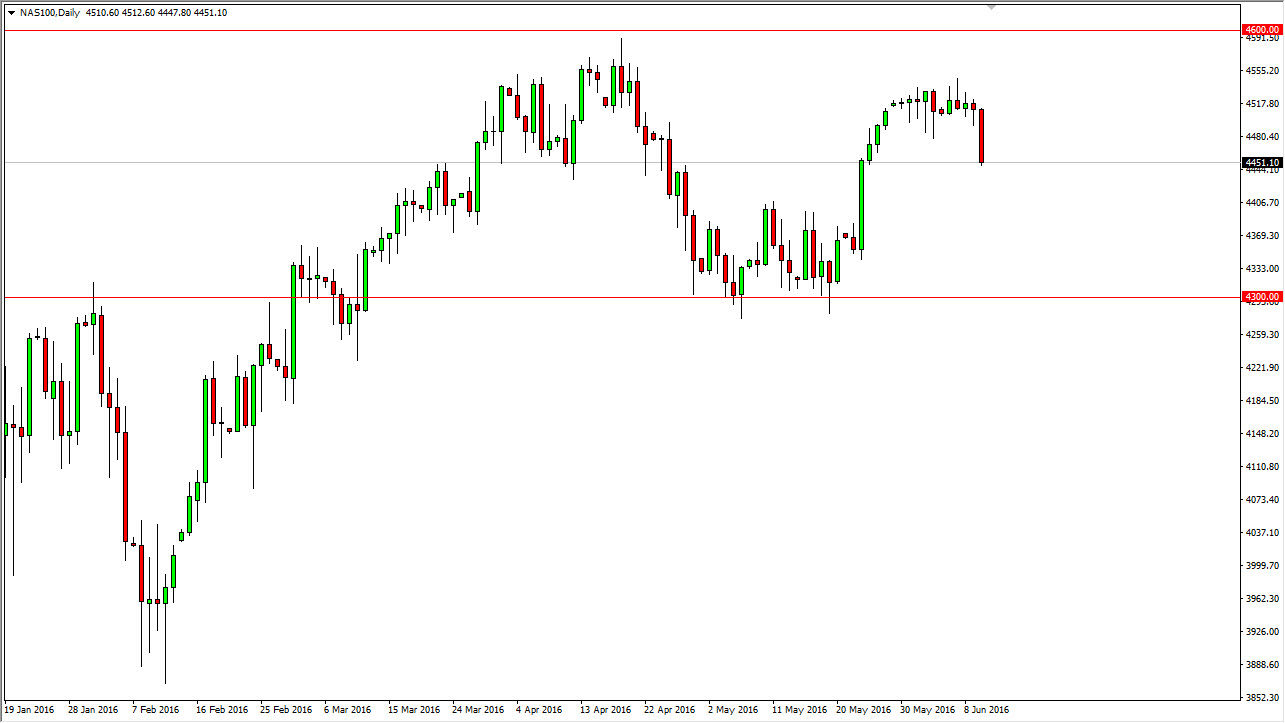
The NASDAQ 100 broke down as well, and as a result it looks as if it is going to try to find support below. I think the support level is somewhere near the 4400 level, and extends all the way down to the 4300 handle. I think that support is found in an area that could be rather strong, and having said that a supportive candle would be reason enough to start going long. The fact that we are closing at the very bottom of the range for the session on Friday also suggests that we could of course continue to go lower, as normally when we see a market close at this extreme part of the range, it means that the sellers are very much in control all of a sudden. However, I still find it difficult to believe that everything has changed completely.


