S&P 500
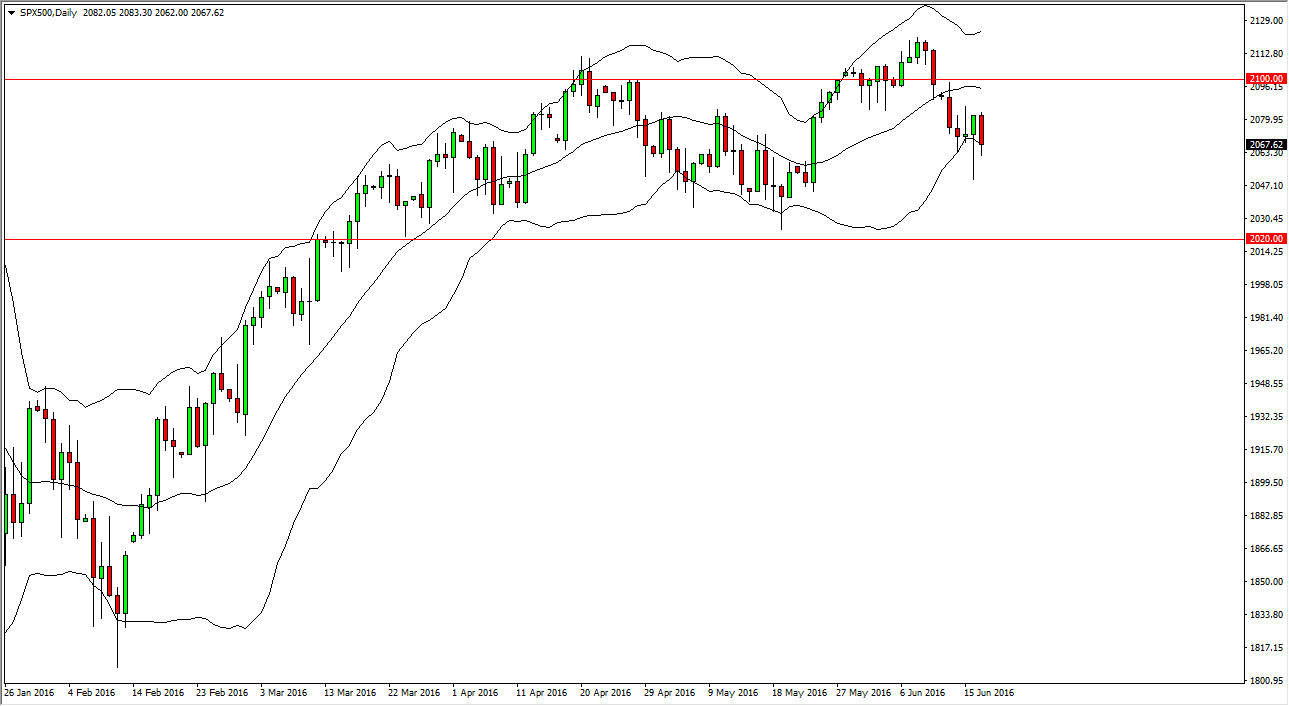
The S&P 500 fell slightly during the course of the session on Friday, testing the bottom of the Bollinger band indicator that I have on this chart. The market looks as if it is a little bit oversold based upon that, and it’s likely that the market will try to reach back towards the 2100 level given enough time. We need to see a supportive candle in order to feel comfortable buying, but at this point time we certainly would not be selling. The hammer that formed on Thursday was of course very bullish, and should offer support all the way down to the bottom of the Thursday range. This is a market that seems to be very bullish of the longer-term, but we have been grinding sideways recently. Because of this, I believe that the market will go higher, but it is going to be slow.
NASDAQ 100
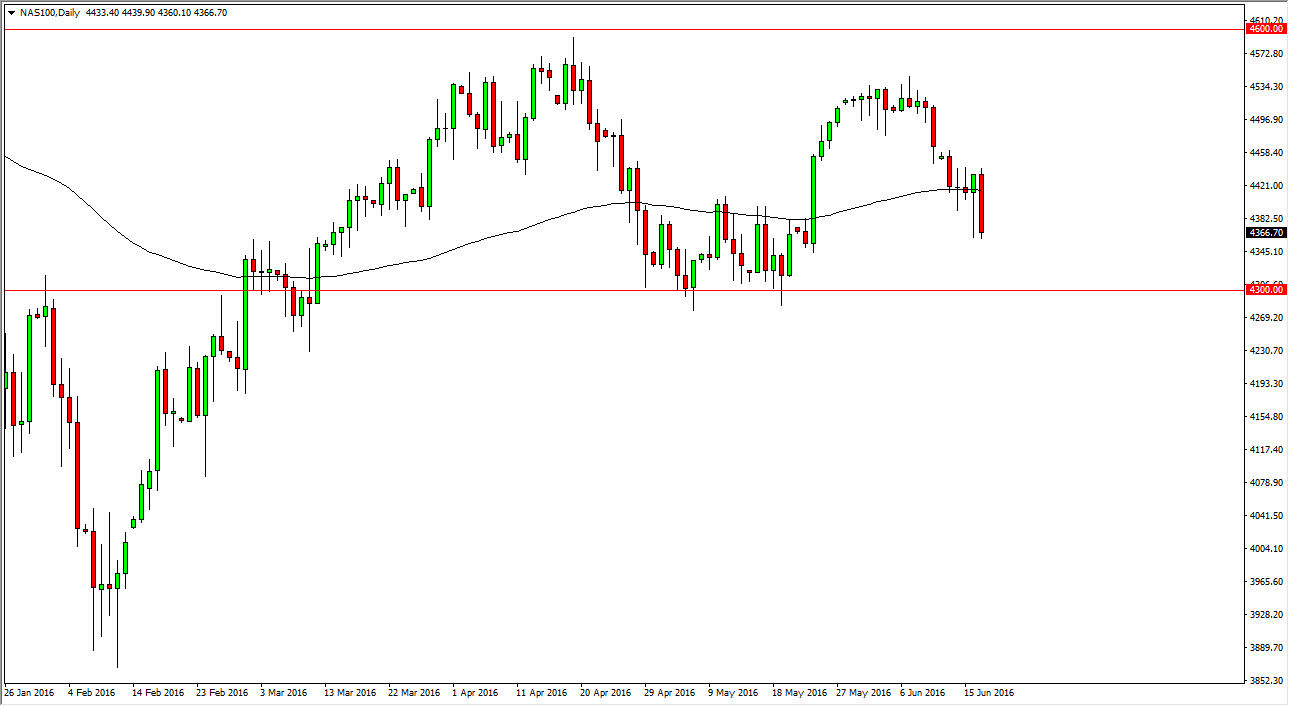
The NASDAQ 100 fell significantly during the course of the session on Friday, testing the bottom of the hammer from Thursday. Ultimately, this is a market that should continue to find interest and as a result it’s likely that we will see a bounce sooner or later. I believe that there is a bit of a “floor” in the market and the 4300 level. Ultimately, I need to see some type supportive candle in order to start placing this trade, and as long as we stay above the 4300 level I think that this is going to essentially be “buy only.”
However, we also could be selling this market if we break down below the 4300 level as it is a very supportive area. If we break down below there, the market should really start to go lower with a bit of momentum. Ultimately, this is a market that will see quite a bit of volatility as we are starting to try to come to grips with what the Federal Reserve can or cannot do as far as interest rates are concerned.


