WTI Crude Oil
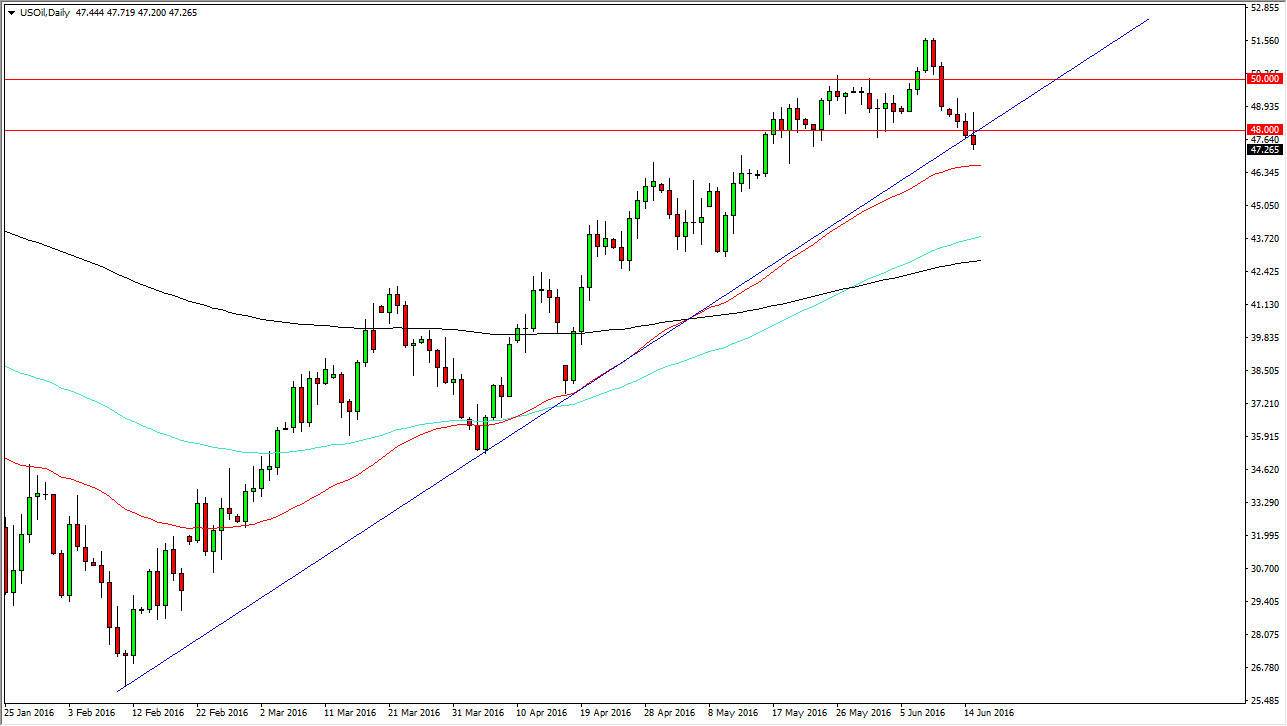
The WTI Crude Oil market initially tried to rally during the course of the day on Wednesday but turn right back around to form a shooting star. The shooting star of course is a very negative sign, and as a result we very well could break down from here. The shooting star sits right at the uptrend line, so if we can break down below the bottom of the candle, we very well could find yourself testing the 50 day exponential moving average below, which is marked by the red line on this chart. It’s not until we break down below there that I am willing to start selling this market, so at this point in time I am simply waiting. On the other hand, if we can break above the top of the shooting star, that should send this market looking for the $50 level and perhaps even continue the longer-term uptrend.
Natural Gas
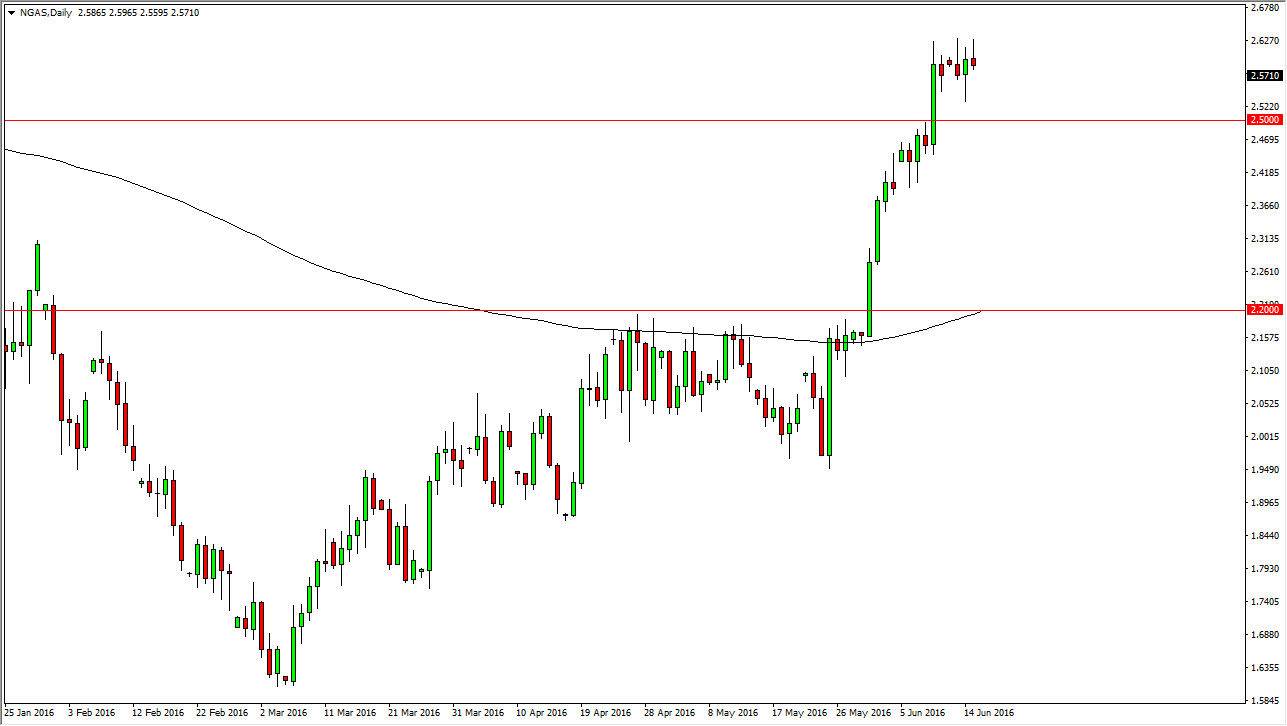
The natural gas markets initially tried to rally during the course of the day on Wednesday, but turn right back around to form a shooting star. The shooting star of course is negative, but it is also preceded by a hammer which is positive. Recently, we have had a nice move higher, so I believe at this point in time the market will more than likely find buyers below and supportive candles could be used as a reason to get involved. I like buying dips, and as a result will simply wait for them to appear.
The $2.50 level is of course supportive, as it was previously resistive. The market extends all the way down to the $2.42 level so I think that any type of supportive candle in that area would be reason enough to go long. If we can break down below the $2.40 level, at that point in time I think that could probably sell down to the $2.20 level.


