WTI Crude Oil
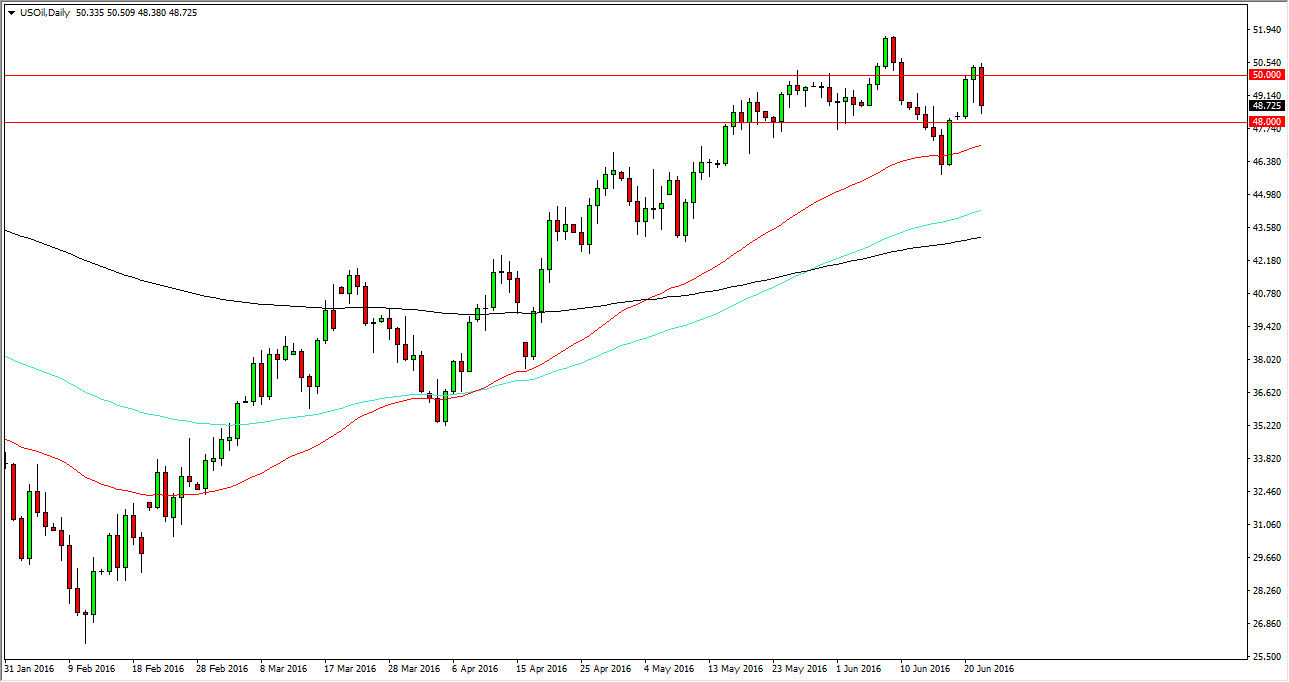
The WTI Crude Oil market fell during the course of the day on Wednesday, but found enough support just below the $50 level to turn things back around and form a little less destructive candle that we had intentionally trying to do. Having said that, we did break down below the bottom of the hammer from the previous session which is a fairly negative sign but it is not until we break down below the 50 day exponential moving average that I’m willing to start selling this market. (On this chart, the 50 day exponential moving average is red.) Ultimately, this is a market that has quite a bit of bullish pressure underneath it, so I think that we will have quite a bit of volatility. The weekly candle was a shooting star though, so having said that it’s likely that the market will continue to go back and forth as we have seen so much resistance above.
Natural Gas
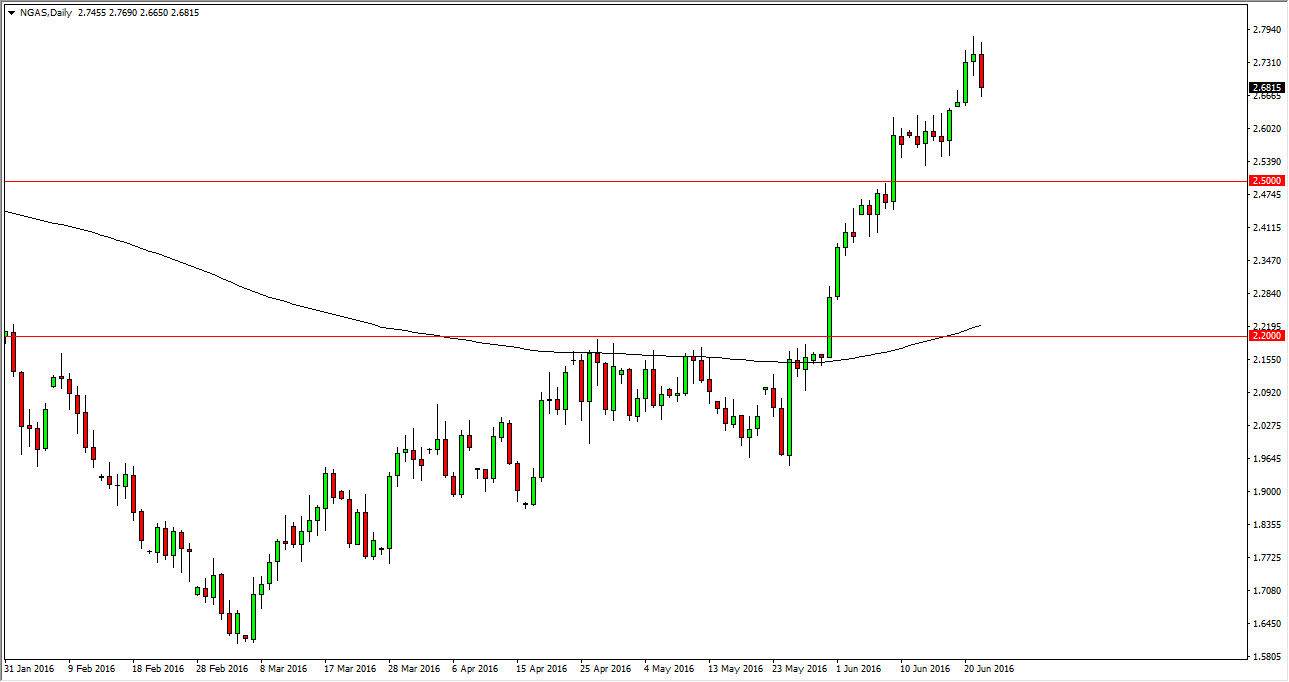
Natural gas markets initially tried to rally, but turned back around to form a massive red candle. That being the case, the market looks as if there is an attempt going on right now to test the $2.60 level for support. That being the case, I think that sooner or later we will get a supportive candle, but until then it looks as if the market is probably going to continue going lower.
The fact that we are closing at the very bottom of the range for the session suggests that the market could see quite a bit of pressure today, but I don’t think we are going to completely break down. This is more or less is a pullback that gives us an opportunity to find value in a market that has certainly been very bullish lately. This is a market that doesn’t offer selling opportunities until we get below the $2.40 level.


