WTI Crude Oil
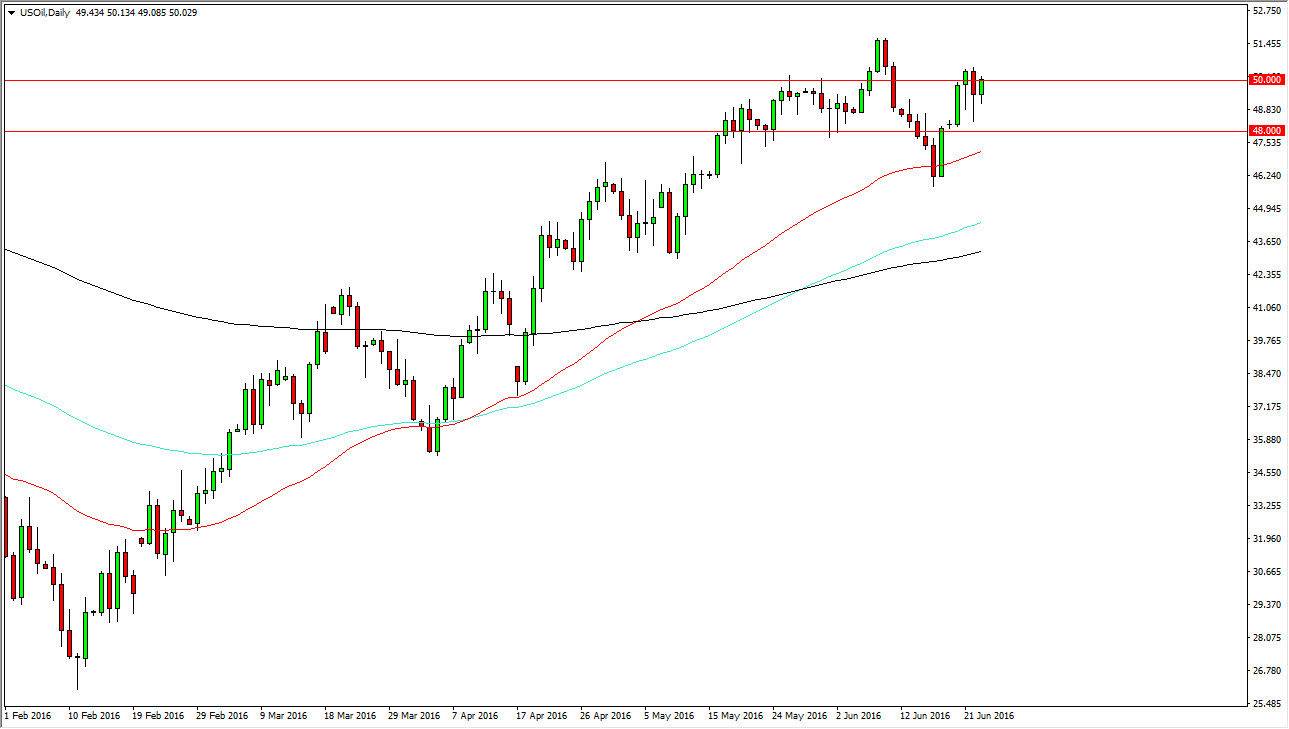
The WTI Crude Oil market fell initially during the day on Thursday, but found enough bullish pressure to break back towards the $50 level. Ultimately, we have quite a bit of bullish pressure in this market over the longer term anyway, and of course I have moving averages on the chart that suggests that we are starting a possible longer-term uptrend. The red moving averages the 50 day exponential moving average, and that has offered quite a bit of dynamic support recently. The green 100 day exponential moving average is above the black 200 days exponential moving average, and as a result it looks as if the buyers are really starting to take this market by the throat at the moment. Ultimately, this market should continue to find buyers until we pullback.
Natural Gas
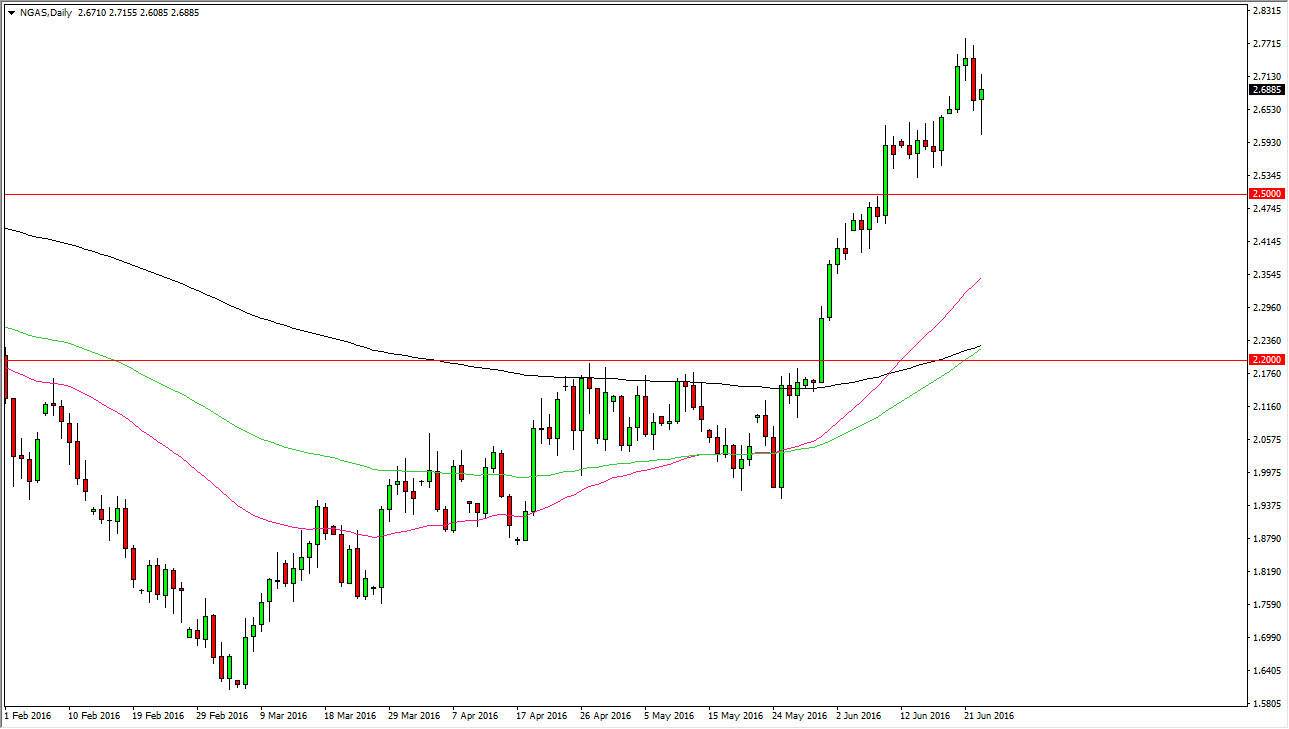
The natural gas markets fell initially during the course of the day but bounced enough to form a bit of a hammer. The hammer of course is a bullish sign and I believe that a break above the top of that hammer would be a buying opportunity. There is a significant amount of noise near the $2.60 level low, and I think that should continue to be a bit of a floor. I also believe that the market will find support at the $2.50 level and as a result I have no interest in selling and believe that sooner or later we will continue to go higher.
Longer-term, it is possible that we will get sellers again, but having said that we need to see a longer-term signal in order to take advantage of it in my estimation. At this point, I believe that the buyers will return again and again as this market is certainly very bullish at this point. There is no sign whatsoever in this market falling apart anytime soon.


