WTI Crude Oil
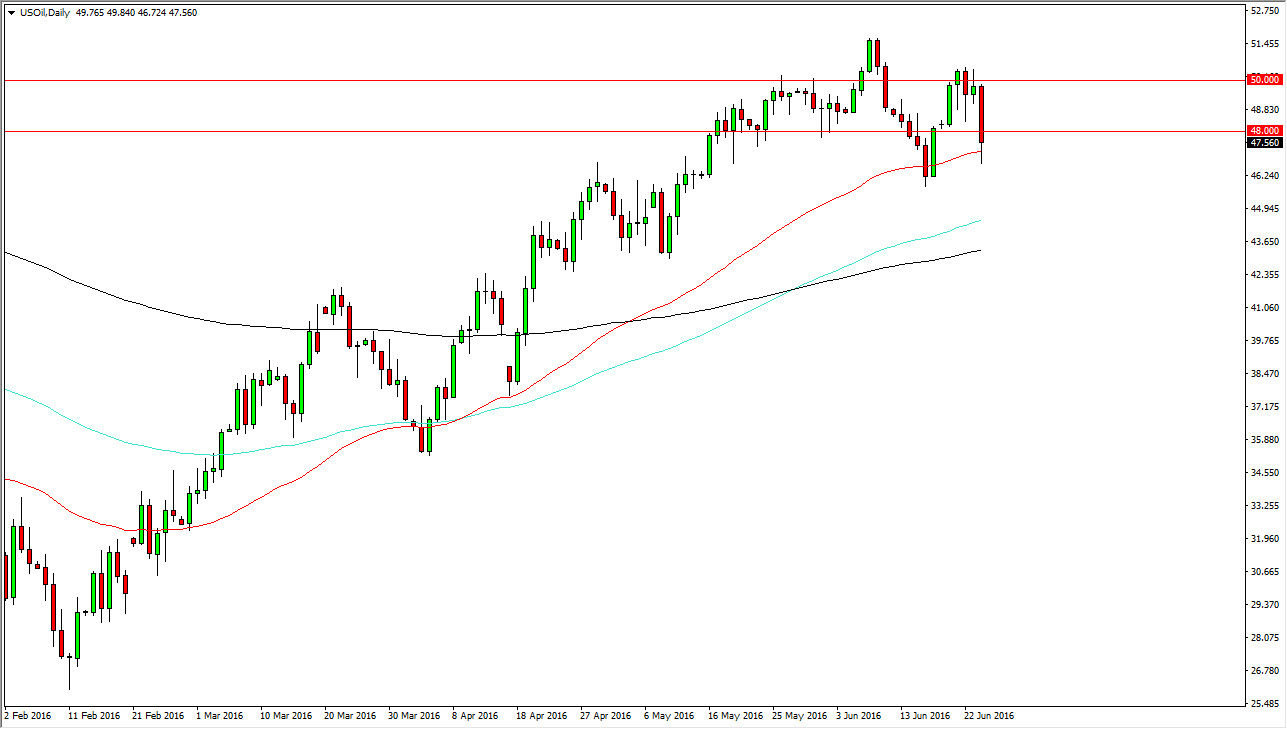
The WTI Crude Oil market fell somewhat significantly during the course of the session on Friday as we got news that the United Kingdom was leaving the European Union. We crashed into the 50 day exponential moving average, which should be somewhat dynamically supportive. In fact, we bounced towards the end of the day so the question then remains whether or not we can get a little bit of follow-through during the day. On the chart, you can see that I have the 50 day, the 100 day, and the 200 day exponential moving averages. At this point in time, the longer-term trend is still to the upside but we need to see some type of bounce or supportive candle in order to start going long. On the other hand, if we break down below the $46 level, I believe we will then reach down towards the 200 exponential moving average, colored black on this chart.
Natural Gas
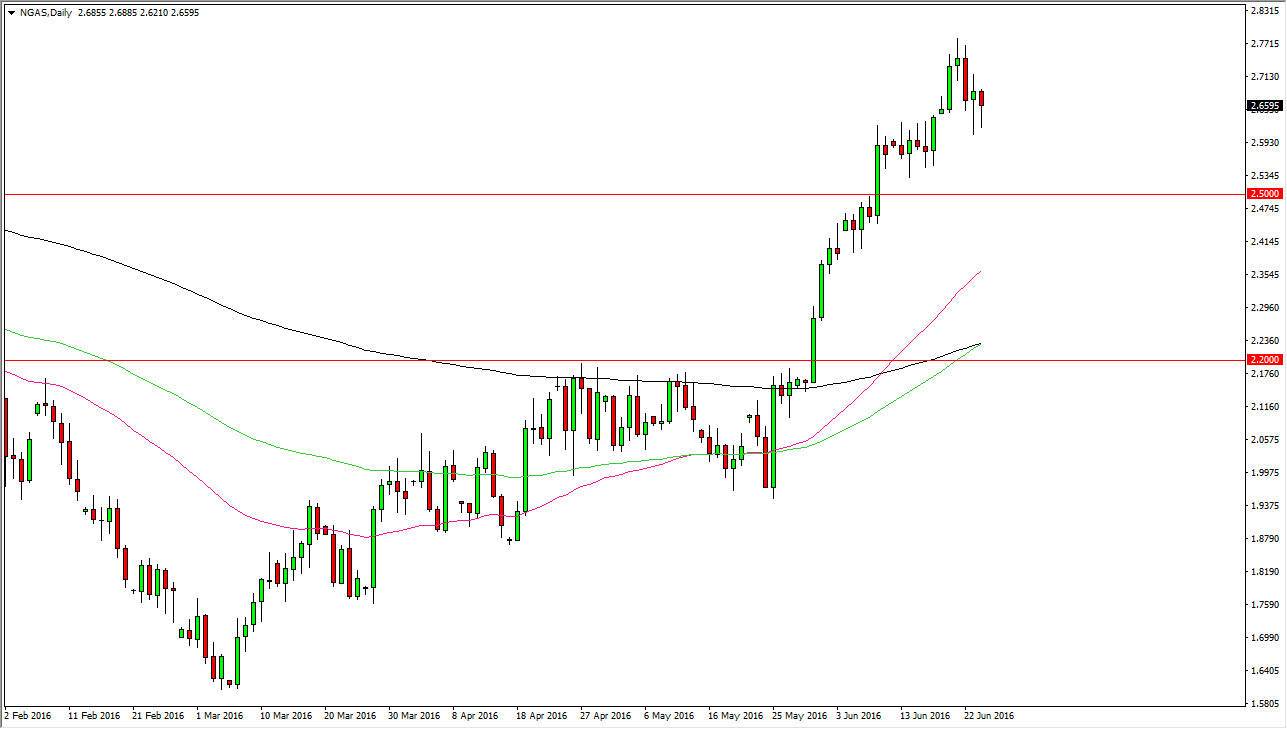
The natural gas markets fell initially during the day on Friday, but turned back around to form a bit of a hammer. We also formed a hammer on Thursday, using the $2.60 level as support so it looks as if the buyers are continuing to trying to show some type of strength. In fact, I believe that the market has support all the way down to at least the $2.50 level, if not the $2.40 level. On the chart, you can see that the 100 day exponential moving average is getting ready to cross above the 200 day exponential moving average, as the 50 day exponential moving average already has. This is the essence of a longer-term uptrend, and it does appear that we are trying to establish where we are going for the long-term now. At this point, it certainly looks like the buyers are in control and therefore I have no interest in selling currently.


