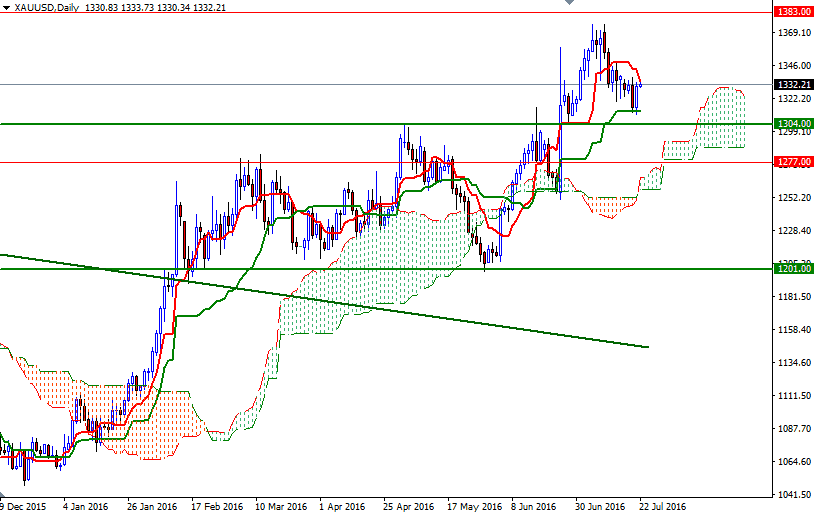
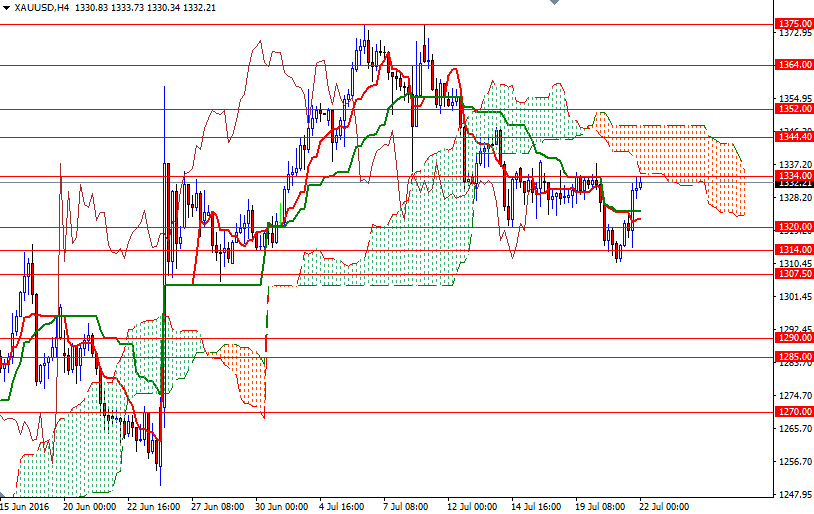
Gold settled up $15.03 at $1330.78 an ounce on Thursday, recouping most of the losses from the previous session, after the European Central Bank signaled it was ready and willing to ramp up stimulus to lift inflation and economic growth in coming months. On the economic data front, the U.S. Labor Department reported that the number of first-time applicants for jobless benefits dropped by 1K to 253K and the Federal Reserve Bank of Philadelphia said its manufacturing index dropped to -2.9 from 4.7. The XAU/USD pair pierced through the $1326 level and reached the $1334/2 area as expected.
Although the market is currently trading above the Ichimoku clouds on the weekly and daily time frames, the 4-hourly cloud is right on top of us. These clouds not only identify the trend but also define the support and resistance zones. Technically, the overall trend is up when prices are above the cloud, down when prices are below the cloud and flat when they are in the cloud itself. The thickness of the cloud is also relevant, as it is more difficult for prices to break through a thick cloud than a thin cloud.

The cloud on the 4-hour chart currently occupies the area between the 1334 and 1347.60. That means the bulls have to deal with a significant amount of pressure in order to take the control back. If XAU/USD anchors somewhere above 1347.60, I think the market will proceed to the 1356/2 area. A break up above 1356 would be a bullish sign and open a path to 1364. On the other hand, if the 4-hourly cloud continues to offer resistance, then it is likely that we are going to see a downwards move. In that case, I think the 1325/0 zone where both the Tenkan-sen (nine-period moving average, red line) and Kijun-sen (twenty six-period moving average, green line) reside will be the next stop. Once below that, look for further downside with 1317.60 and 1314 as targets.

