S&P 500 Index
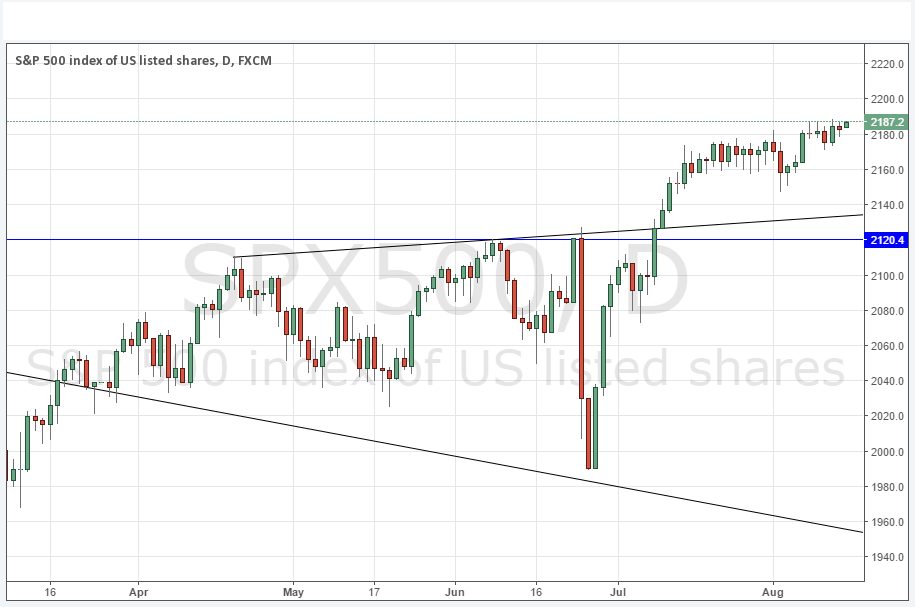
It is impossible not to be bullish of a stock market when it is making all-time highs. This index made a new all-time high last Thursday and again earlier today, and the chart below shows that although it might be due some kind of pull back, there is every indication that it is basically on its way up still higher. In fact, I would say that there is just as much chance of a sudden strong bullish break as there is of a bearish retracement, even though the action has been a little thin. It is this thinness that has concerned some analysts, who tend to argue that if the price was really on its way upwards the bullish candles would have more body to them. I argue that we have actually begun to see these full bodies over the course of the past two weeks. This looks like an impulsive bullish move.
There is support below at around 2120 and also there is a key trend line at around 2137 which could be supportive too, if there is a pull back.
NASDAQ 100 Index
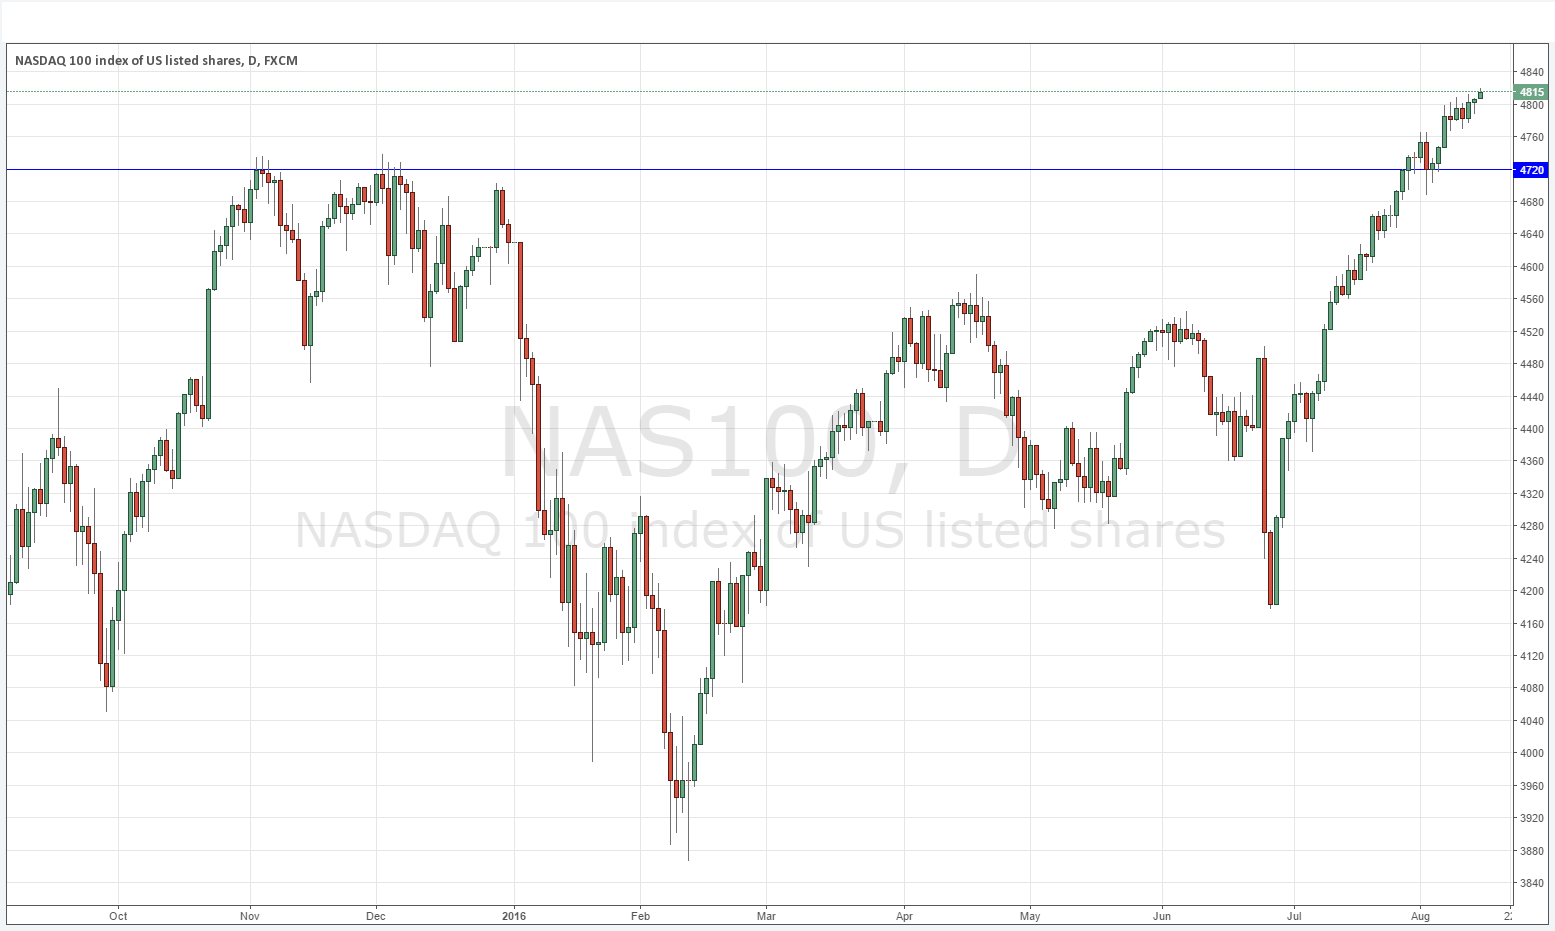
The picture here, unsurprisingly, is very similar to what I wrote above regarding the S&P 500 Index, yet even more bullish. The all-time highs are more pronounced, with a very clear resistance flipped to support level at 4720 which is anchoring the latest push up. I do not see any reason to be anything but bullish in every way here, especially with the last two daily candles printing as bullish outside and bullish inside candles, the latter with a bullish pin shape too.


