The difference between success and failure in Forex trading is very likely to depend upon which currency pairs you choose to trade each week, and not on the exact trading methods you might use to determine trade entries and exits. Each week I am going to analyze fundamentals, sentiment and technical positions in order to determine which currency pairs are most likely to produce the easiest and most profitable trading opportunities over the next week. In some cases it will be trading the trend. In other cases it will be trading support and resistance levels during more ranging markets.
Big Picture 11th September 2016
Last week I predicted that the best trade for this week was likely to be long GBP/JPY. The result of this trade was not good, producing a loss of 1.40% thanks to the relatively strong performance by the Japanese Yen over the week.
The market is difficult to forecast at the moment as the two strongest long-term trends appear to be flattening/ending or even turning, although both GBP/USD and USD/JPY have moved in the directions of their respective long-term trends this week.
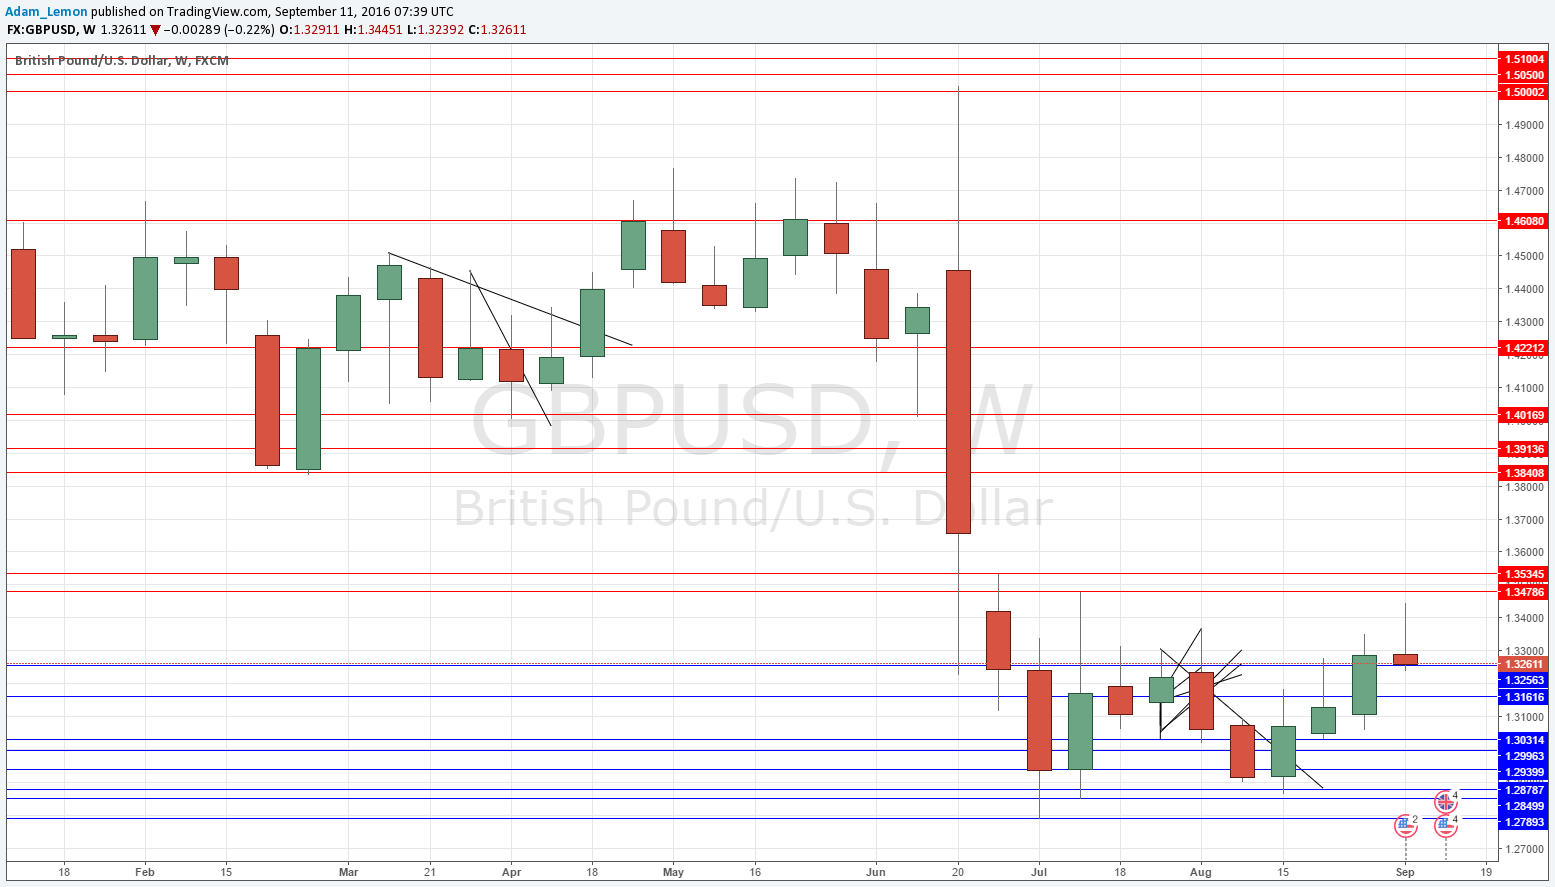
I did note last week that the GBP/USD pair had reached an area of key resistance and could find it hard to rise much further. This is more or less what happened with that pair.
This week I suggest that the best trades are likely to be short USD/JPY and GBP/USD, both in line with long-term multi-month trends.
Fundamental Analysis & Market Sentiment
Fundamental analysis is of little use at the moment. The market is being driven mostly be sentiment which see-saws with contradictory statements from FOMC members regarding the prospect of a U.S. rate hike.
The British Pound has been falling on the back of a worse than expected British economic data release.
Elsewhere, sentiment factors remain the key drivers.
Technical Analysis
USDX
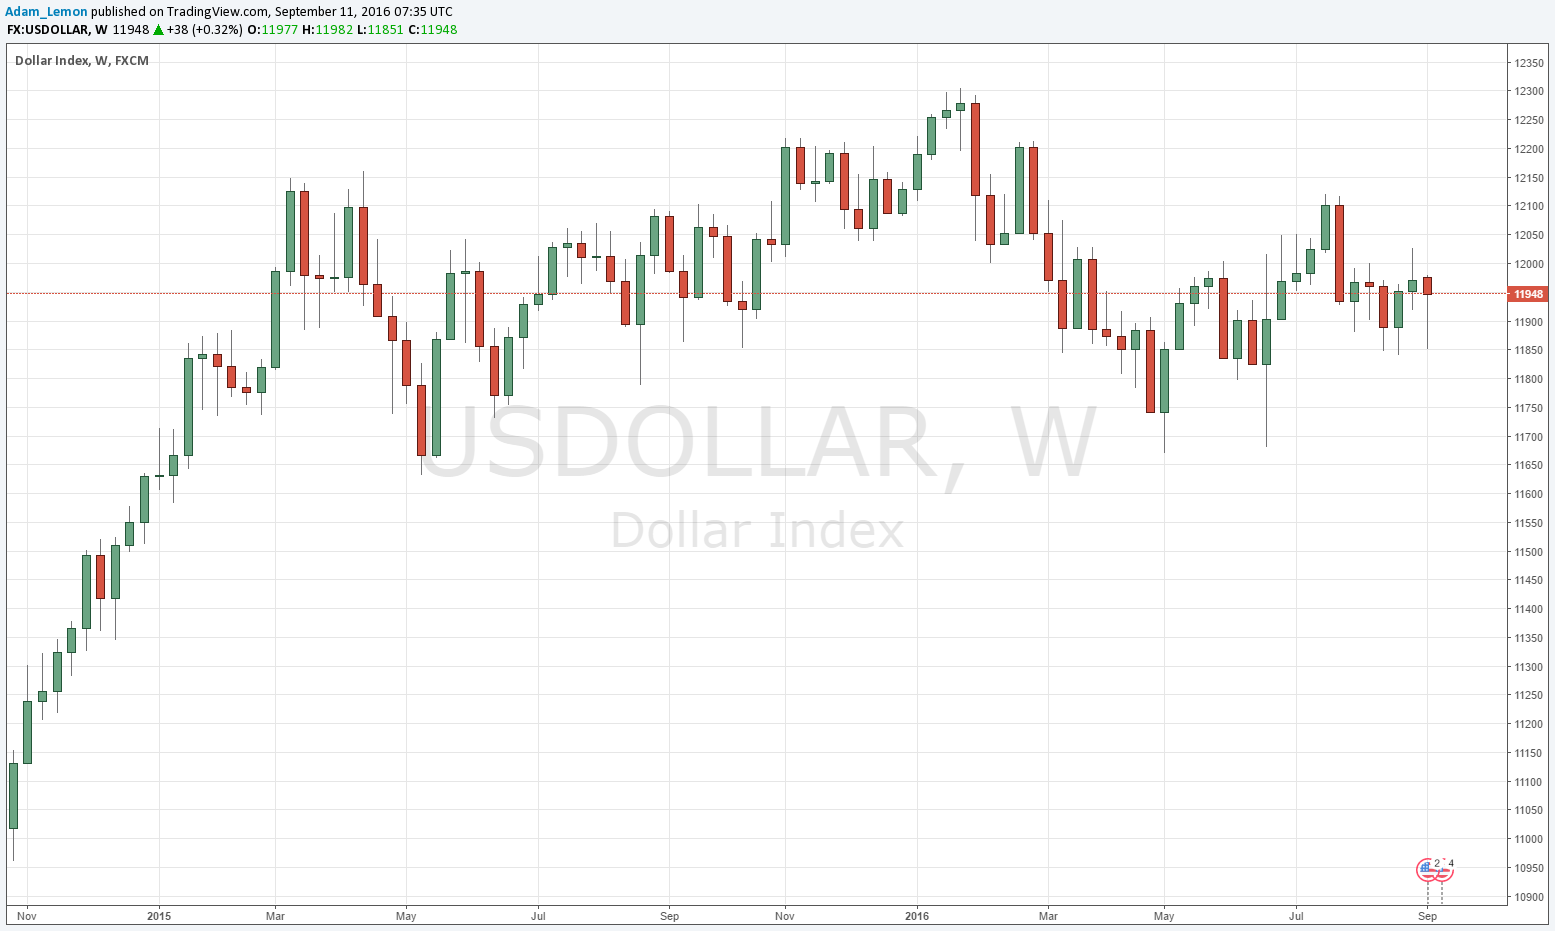
The U.S. Dollar technically still has no trend, being in between its historical prices from 13 and 26 weeks ago. A glance at the chart below will show that it sits right in the middle of its range that has been established ever since the end of the first quarter of 2015. This week’s candle is bullish but only slightly so. For these reasons, the next move by the U.S. Dollar is extremely hard to forecast.
GBP/USD
The chart below shows that this pair made a bearish pin candle last week, although it is not an especially large or convincingly bearish candle. There is a long-term downwards trend but new lows have not been made for several weeks, and we have about ten weeks of consolidation. It does look quite possible that the price will be capped by the 1.3500 area, so downwards movement does seem more probable in the short term, but it is not necessarily going to be very strong.
USD/JPY
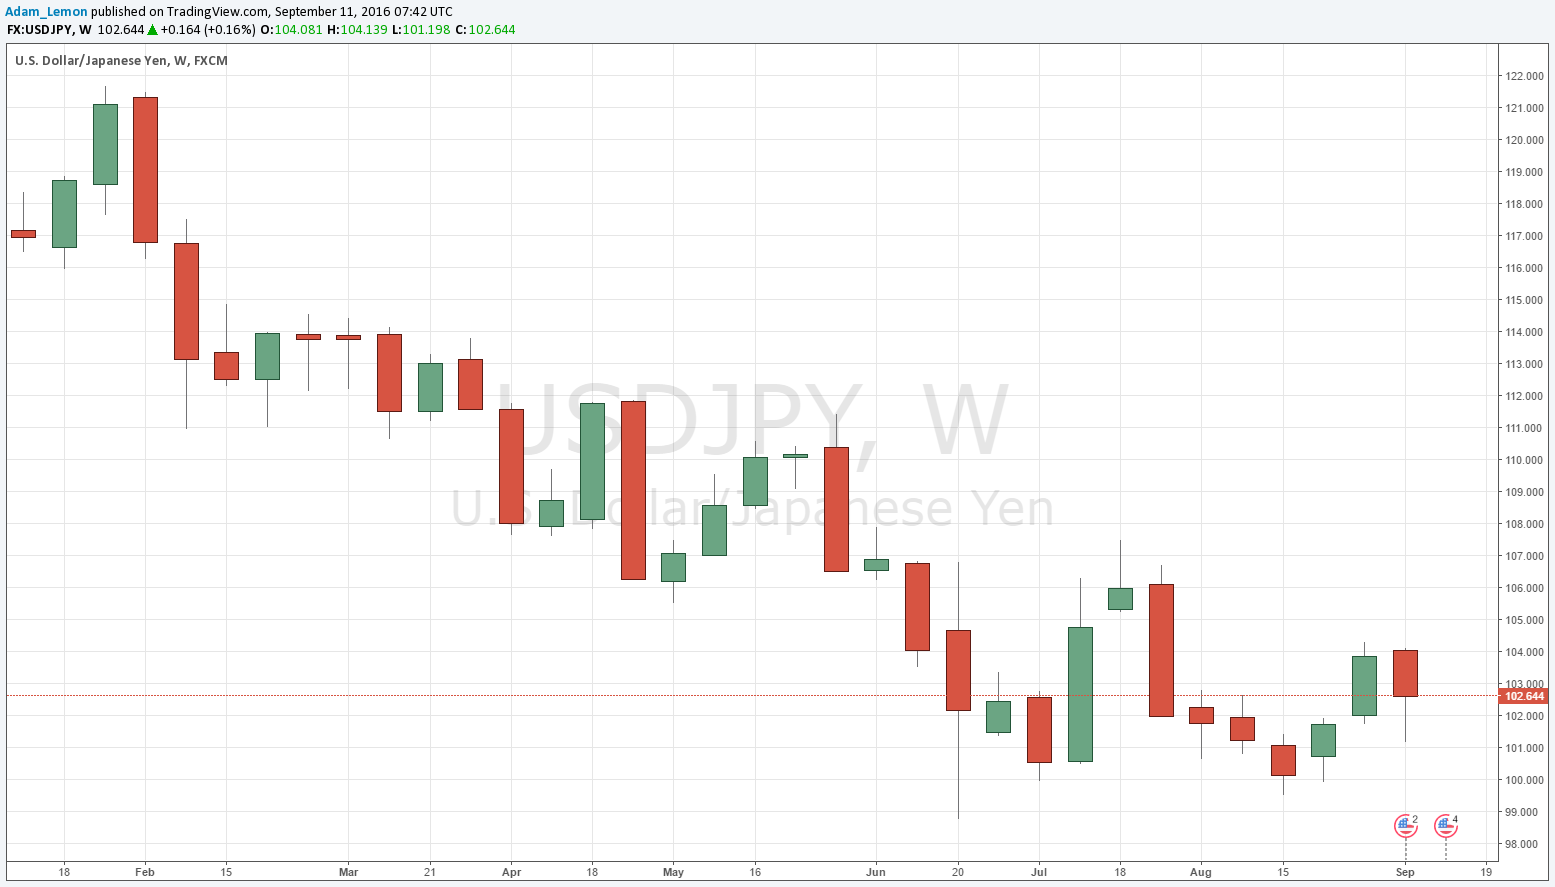
The chart below shows that this pair fell last week, printing a bearish candle, but due to the large lower wick not a very convincing one. There is a long-term downwards trend but new lows have not been made for eleven weeks. Furthermore, we have a real double bottom formation below rejecting the psychologically key area of 100.00 which is a very bullish sign, and there is strong bullish momentum.
The price has bumped up against resistance at 104.00, but if this can be broken, the price could have a clear run up to the 106.00 area at least.
Conclusion
Cautiously bearish on USD/JPY and GBP/USD.


