The difference between success and failure in Forex trading is very likely to depend upon which currency pairs you choose to trade each week, and not on the exact trading methods you might use to determine trade entries and exits. Each week I am going to analyze fundamentals, sentiment and technical positions in order to determine which currency pairs are most likely to produce the easiest and most profitable trading opportunities over the next week. In some cases it will be trading the trend. In other cases it will be trading support and resistance levels during more ranging markets.
Big Picture 25th September 2016
Last week I predicted that the best trades for this week were likely to be short GBP/USD and USD/JPY. Both of these trades were winners this week, especially short USD/JPY, producing an averaged return of 0.76%.
The market is easier to forecast at the moment as one of the strongest long-term trends appears to be moving again - GBP/USD – while USD/JPY is perhaps looking flatter, but is still currently moving in trend.
This week I again suggest that the best trades are likely to be short USD/JPY and GBP/USD, both in line with long-term multi-month trends.
Fundamental Analysis & Market Sentiment
Fundamental analysis is of little use at the moment although better-than-expected U.S. economic data has been boosting the greenback. The market is being driven mostly be sentiment which see-saws with contradictory statements from FOMC members regarding the prospect of a U.S. rate hike. However, the FOMC overall is somewhat more bullish on the prospect of a December rate hike than it was.
The British Pound has been falling on the back of worse than expected British economic data releases.
Elsewhere, sentiment factors remain the key drivers.
Technical Analysis
USDX
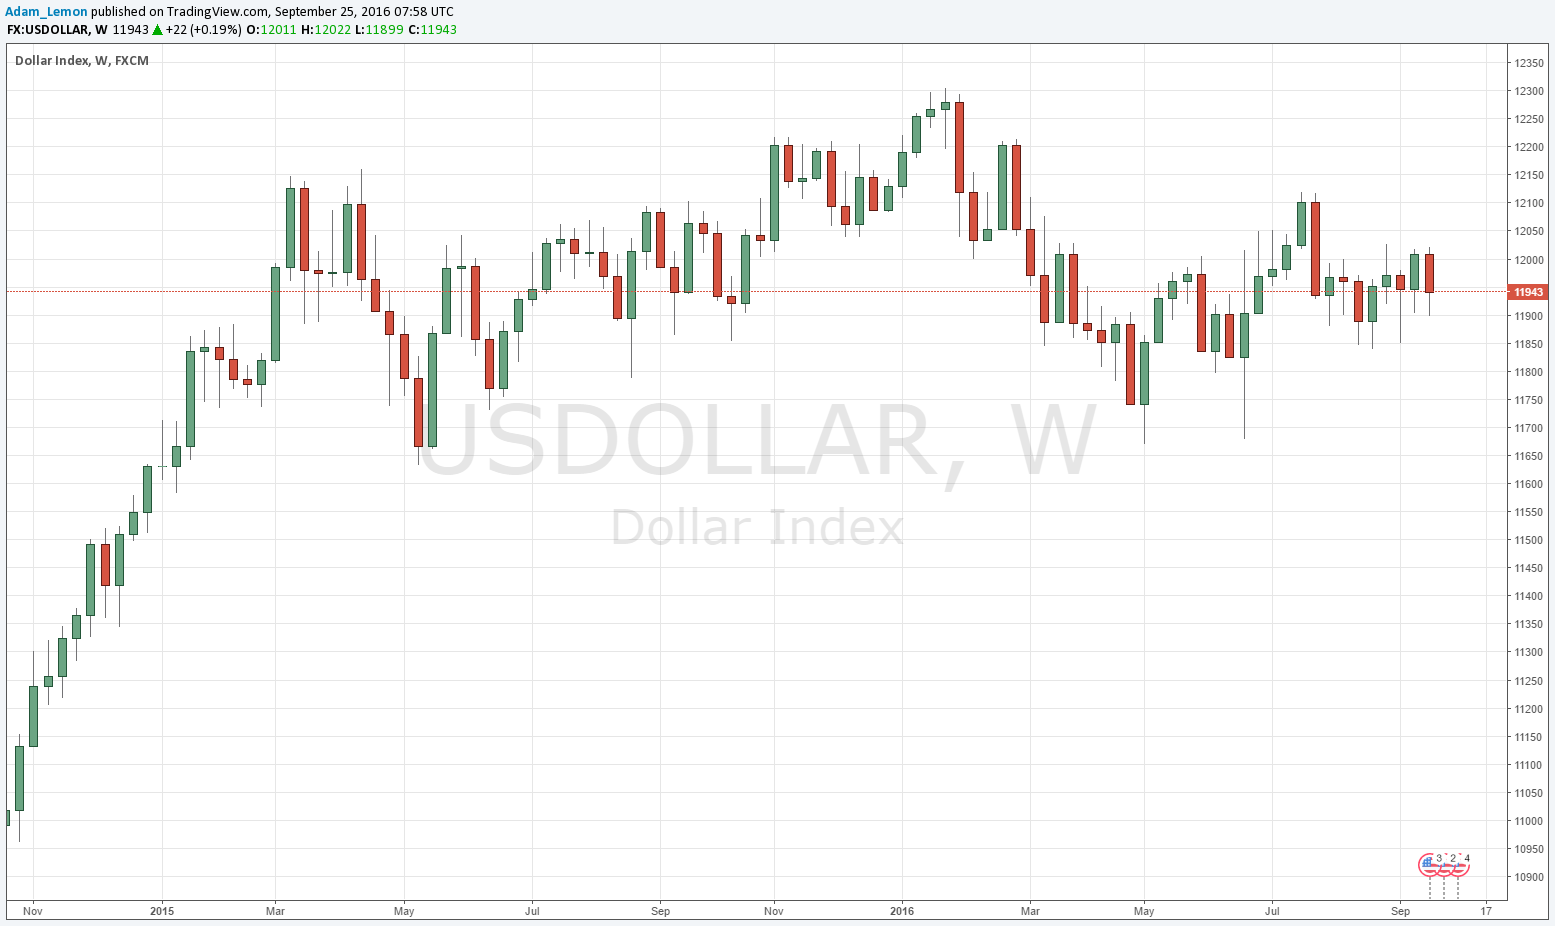
The U.S. Dollar technically has no trend, being caught between its historical prices from both 13 and 26 weeks ago. A glance at the chart below will show the action is choppy and consolidative. However, we are closer to the start of an upwards trend than a downwards trend, so that might be the most likely future trend development.
GBP/USD
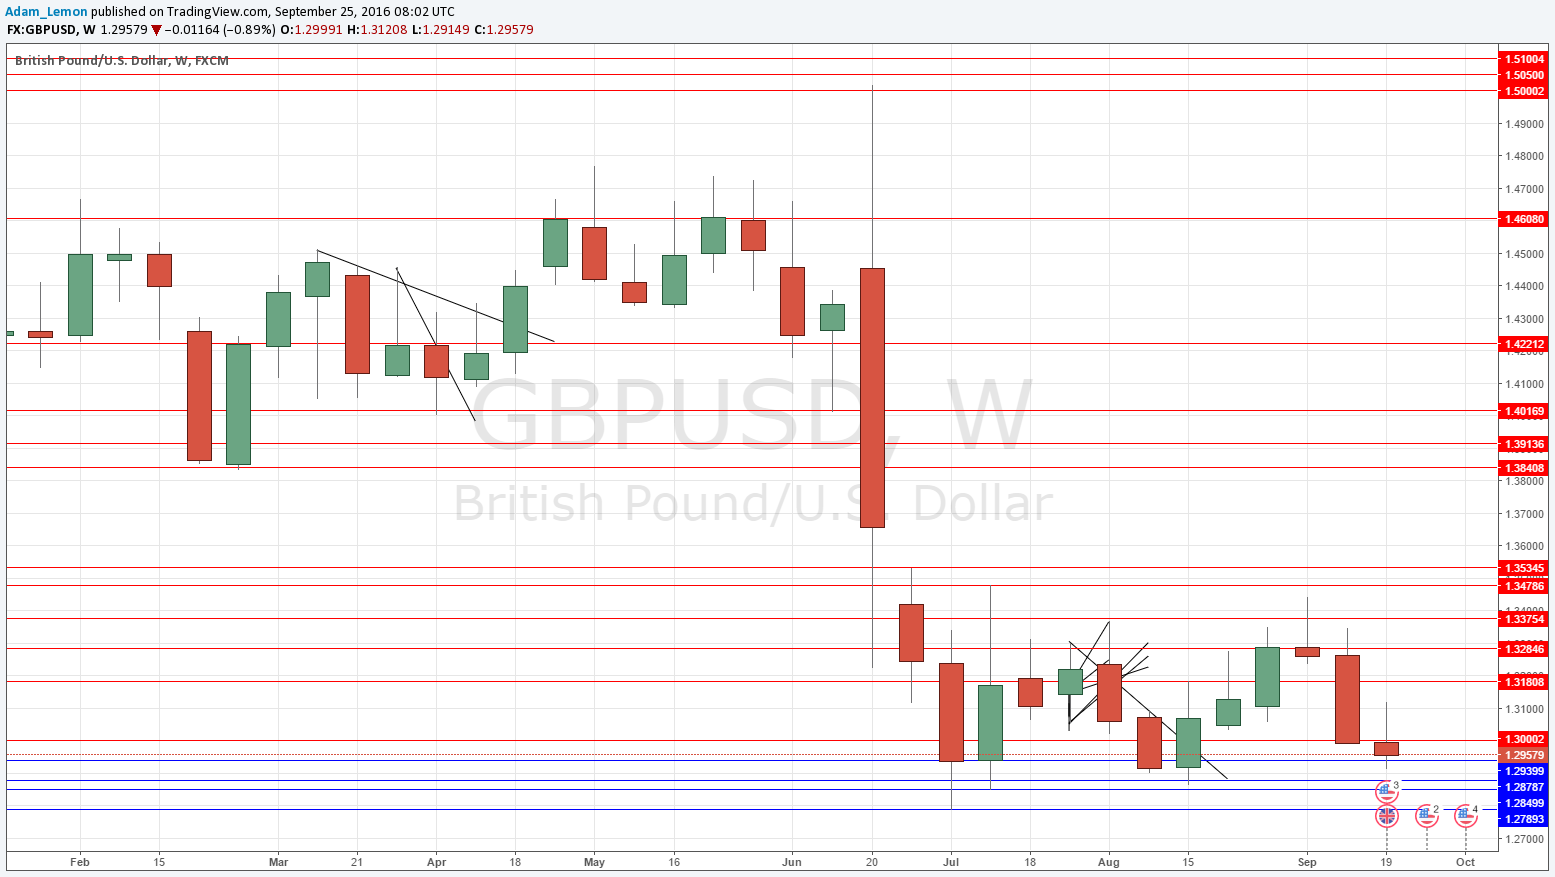
The chart below shows that this pair made another bearish candle last week, and although it is not a large candle it closed fairly bearishly near its low. There is a long-term downwards trend and although new lows have not been made for several weeks, the price is finally threatening to make a new low again. Beware of the supportive area from about 1.2875 to 1.2750.
USD/JPY
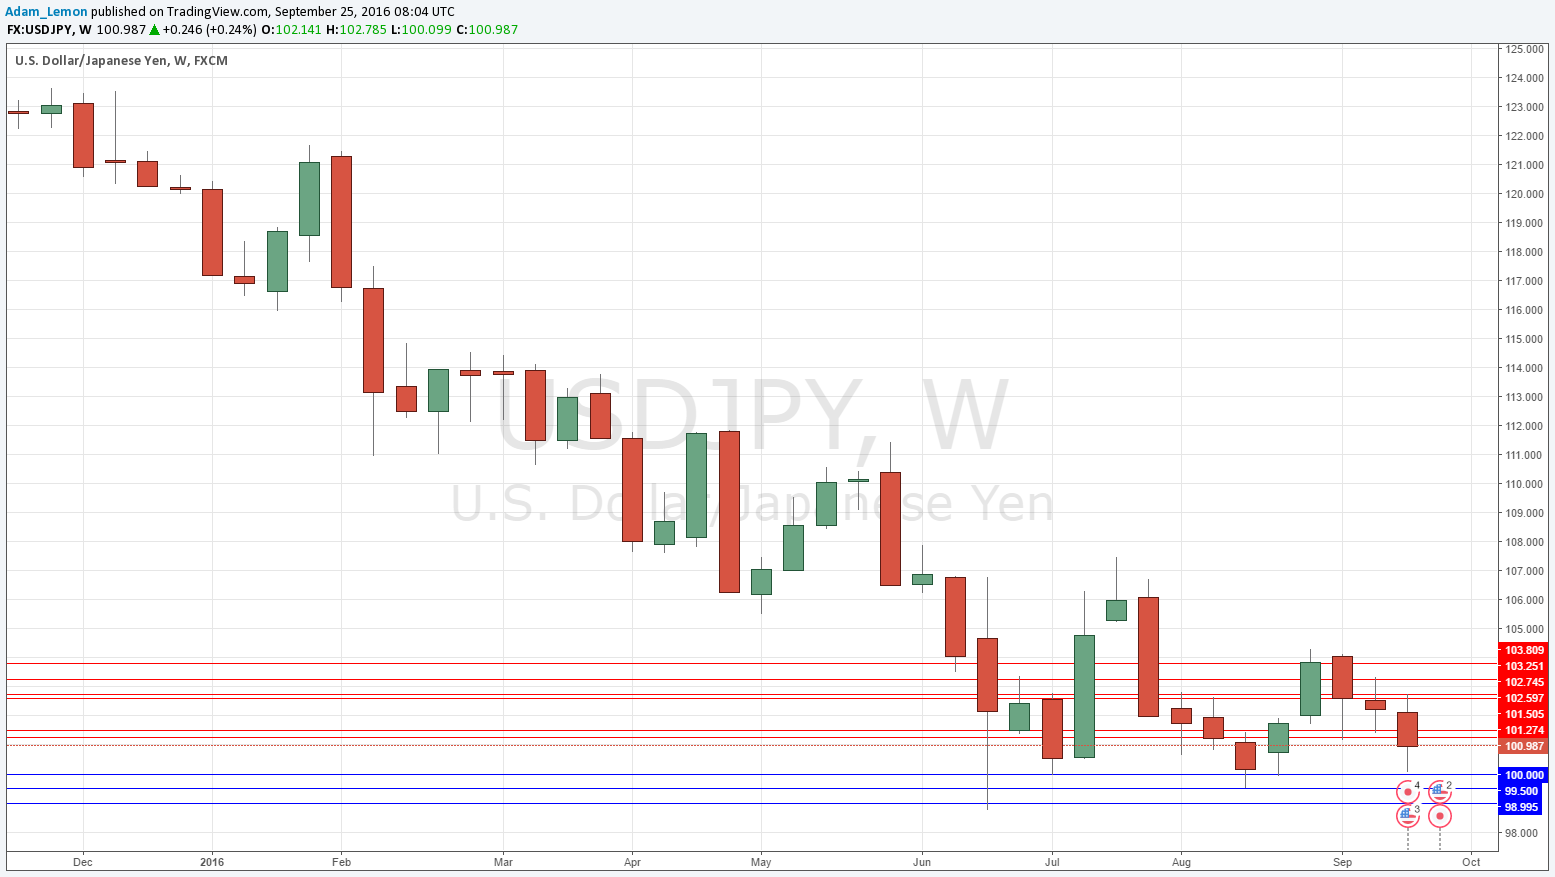
The chart below shows that this pair dropped last week, by a fair amount, printing a bearish candle, albeit one with a substantial lower wick. There is a long-term downwards trend but new lows have not been made for thirteen weeks. Furthermore, we have a real double bottom formation below rejecting the psychologically key area of 100.00 which is a bullish sign.
It seems as if the price is really going to have break down past several support levels which are looking increasingly strong in order to fall much further.
Conclusion
Bearish on USD/JPY and especially GBP/USD.


