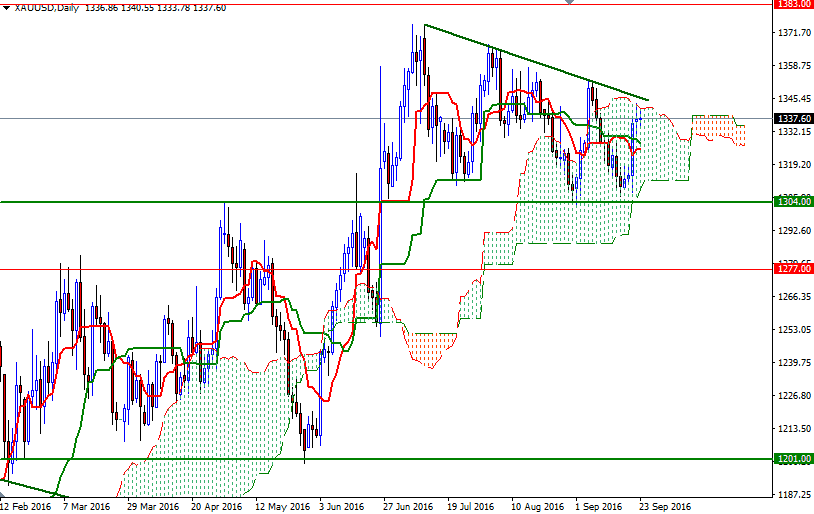
Gold prices settled at $1337.60 an ounce on Friday, gaining 2.13% on the week, as the dollar came under pressure after the Federal Reserve held interest-rates unchanged at its monetary policy meeting. Speaking to reporters after the meeting, Fed Chair Yellen said “The recent pickup in economic growth and continued progress in the labor market have strengthened the case for an increase in the federal funds rate. Moreover, the Committee judges the risks to the outlook to be roughly balanced… But with labor market slack being taken up at a somewhat slower pace than in previous years, scope for some further improvement in the labor market remaining, and inflation continuing to run below our 2 percent target, we chose to wait for further evidence of continued progress toward our objectives.” The XAU/USD pair traded as high as $1343.59 after breaching a key resistance at $1332 lured more buyers into the market.
The longer the Fed holds fire in raising rates, the better for gold - in the near term at least because apparently Federal Open Market Committee members want to raise rates over time in order to respond more effectively to future economic shocks. While traders see a 59% chance the Fed will raise interest rates at its December meeting, they are pricing in very little chance of an increase in November. The latest data from the Commodity Futures Trading Commission (CFTC) revealed that speculative traders on the Chicago Mercantile Exchange reduced their net-long positions in gold to 256179 contracts, from 285413 a week earlier.
From a technical point of view, short-term charts suggest that a test of 1348.53-1346 is likely if the market successfully breaks through 1342. Breaking above the descending trend line would be a bullish sign of course and open a path to 1355/3 which is the next key resistance on the charts. A daily close beyond that barrier would make me think that XAU/USD might be targeting 1360 and 1366.50-1364. On the other hand, the market could come under pressure quickly if prices can't pass through the top of the daily cloud and the aforementioned trend line. In that case, a pull-back towards the 1332/0 zone may not be so surprising. If this support gives way, the next stop will probably be the 1327.40-1324 area where the daily Tenkan-sen (nine-period moving average, red line) and the Kijun-sen (twenty six-period moving average, green line) reside.


