The difference between success and failure in Forex trading is very likely to depend upon which currency pairs you choose to trade each week, and not on the exact trading methods you might use to determine trade entries and exits. Each week I am going to analyze fundamentals, sentiment and technical positions in order to determine which currency pairs are most likely to produce the easiest and most profitable trading opportunities over the next week. In some cases it will be trading the trend. In other cases it will be trading support and resistance levels during more ranging markets.
Big Picture 16th October 2016
Last week I predicted that the best trade for this week was likely to be short GBP/USD. This trade made a profit of 2.01%.
The market seems easier to forecast this week, as the strongest long-term trend (short British Pound) again has strong momentum in the direction of the trend.
For this reason, I suggest that the best trade this week is again likely to be short GBP/USD, in line with its long-term multi-month trend.
Fundamental Analysis & Market Sentiment
Fundamental analysis is of some use right now. Slightly better-than-expected U.S. economic data has been boosting the greenback over recent weeks. There is also an expectation of a rate hike in December and at least one further rate hike during 2017. There is no other major global currency whose central bank is expected to raise rates any time soon.
The British Pound has dived sharply since the British Government announced it is going to being proceedings to leave the European Union next year, with a “hard Brexit” seemingly the exit route, i.e. without the U.K. remaining part of the single market.
It is worth noting that the Australian Dollar is looking like the strongest currency after the U.S. Dollar. If the U.S. Dollar turns more bearish, the Australian Dollar could be the primary beneficiary of that. There is central bank input from the RBA coming this week which could be important.
Technical Analysis
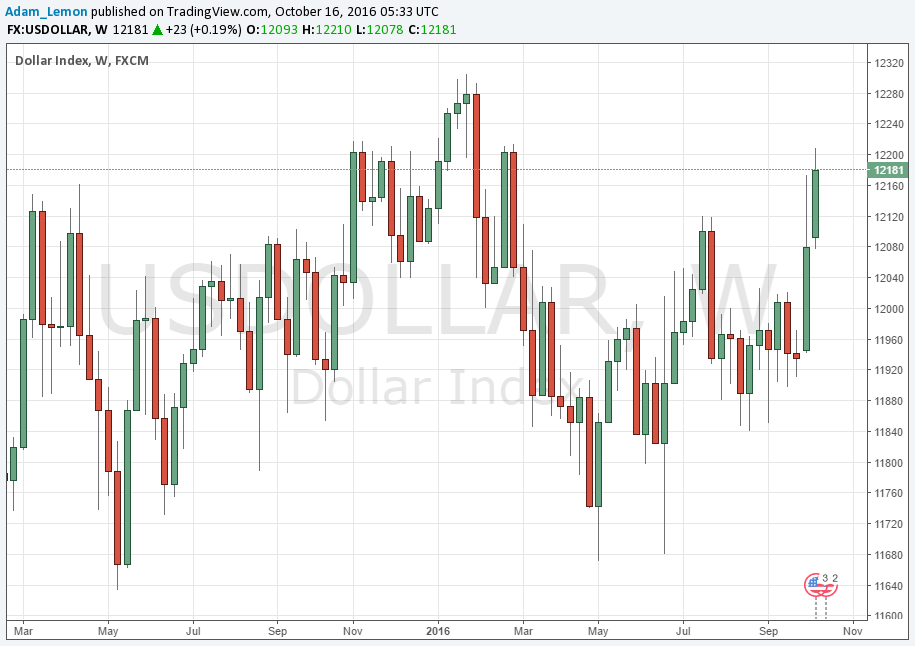
USDX
The U.S. Dollar has a new bullish trend, being above its historical prices from both 13 and 26 weeks ago. Last week’s candle was again long and bullish and in fact, the price closed at a new seven-month high. The situation is definitely looking increasingly bullish.
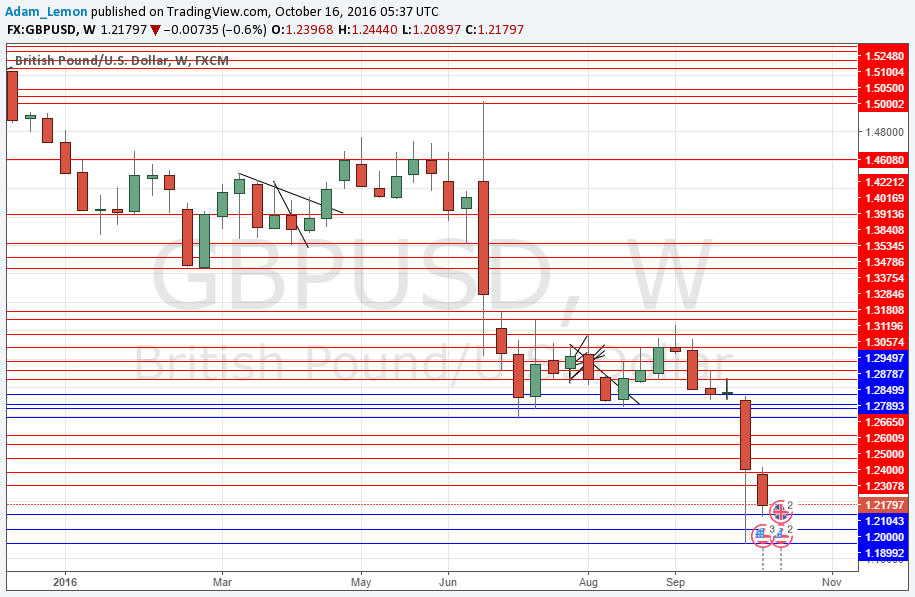
GBP/USD
Last week saw another fairly substantial fall in the price of this pair, by about 2%. Although the weekly candle was an inside candle, last week’s candle was so huge that not much should be read into this. What is more significant, and more of a bearish indicator, is that the downwards movement was almost entirely below last week’s close, and this week’s close it quite hard on the weekly low. For these reasons, technically, a further fall over this coming week looks to be more likely than not.
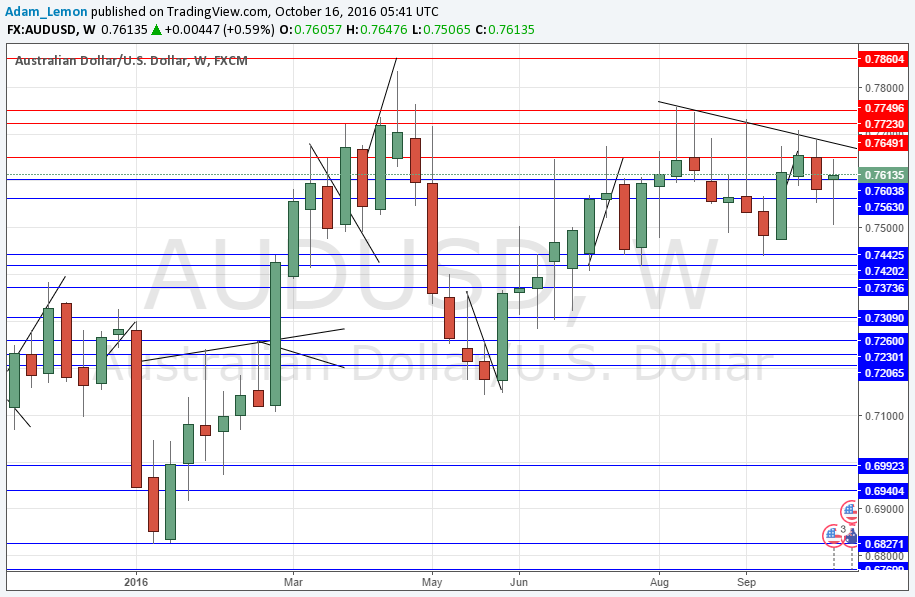
AUD/USD
The chart below shows that the AUD is holding up quite well, in fact it even rose very slightly against the U.S. Dollar in what was a strong week for that currency. However, there is a lot of strong resistance between 0.7650 and 0.7750 the latter of which is a big psychological number. There is a long-term resistant trend line and there has been strong selling in this area for the last 15 months or so. If the U.S. Dollar turns bearish and the price of this pair breaks up past this area, there could be a strong bullish breakout, but it is not clear that the Reserve Bank of Australia would be happy to see such an appreciation.
Conclusion
Bearish on GBP/USD.


