The difference between success and failure in Forex trading is very likely to depend upon which currency pairs you choose to trade each week, and not on the exact trading methods you might use to determine trade entries and exits. Each week I am going to analyze fundamentals, sentiment and technical positions in order to determine which currency pairs are most likely to produce the easiest and most profitable trading opportunities over the next week. In some cases it will be trading the trend. In other cases it will be trading support and resistance levels during more ranging markets.
Big Picture 2nd October 2016
Last week I predicted that the best trades for this week were likely to be short GBP/USD and USD/JPY. Both of these trades were very small losers this week, producing an averaged loss of -0.20%.
The market is harder to forecast at the moment as these two of the strongest long-term trends appear to be flattening out, especially USD/JPY.
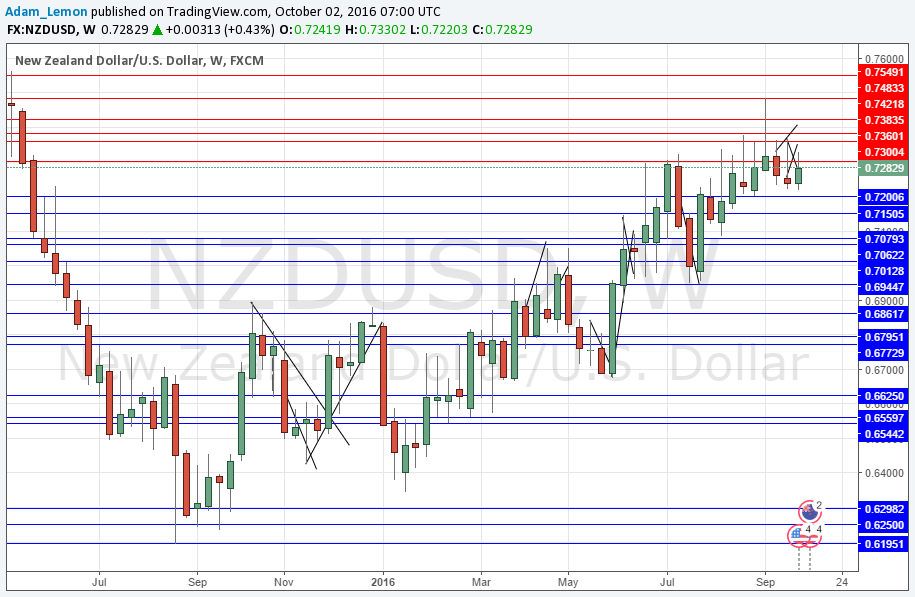
For this reason, I suggest that the best trade this week is likely to be long NZD/USD, in line with its long-term multi-month trend.
Fundamental Analysis & Market Sentiment
Fundamental analysis is of little use at the moment although better-than-expected U.S. economic data has been boosting the greenback. The market is being driven mostly be sentiment which see-saws with contradictory statements from FOMC members regarding the prospect of a U.S. rate hike. However, the FOMC overall is somewhat more bullish on the prospect of a December rate hike than it was.
The New Zealand Dollar pays a higher interest rate than any other major global currency, which is a fundamental factor which helps explain the continuing strength of that currency.
Elsewhere, sentiment factors remain the key drivers.
Technical Analysis
USDX
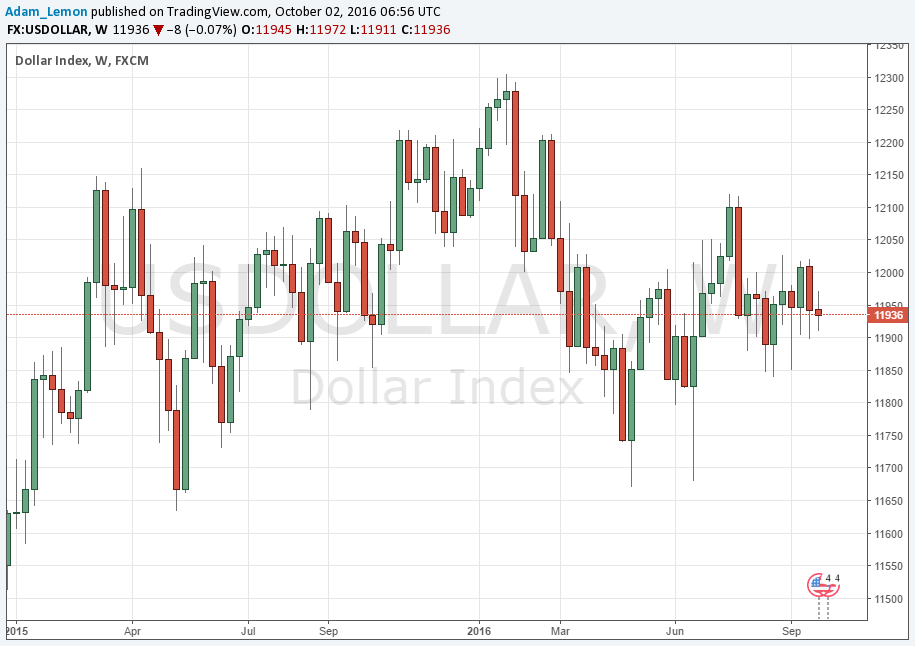
The U.S. Dollar technically has no trend, being caught between its historical prices from both 13 and 26 weeks ago. A glance at the chart below will show the action is choppy and consolidative. It is very hard to say what will happen next. This week’s candle is a small inside candle which gives us no clues.
NZD/USD
The chart below shows that this pair has been in a steadily ascending upwards trend for many months. It should be noted that this pair is tending to move rather slowly. A further note of caution relates to the long upper wicks of recent weekly candles which can be seen in the chart below, rejecting the resistant area beginning at 0.7360. Nevertheless, a trend is a trend and puts the odds in a trader’s favor.
USD/JPY
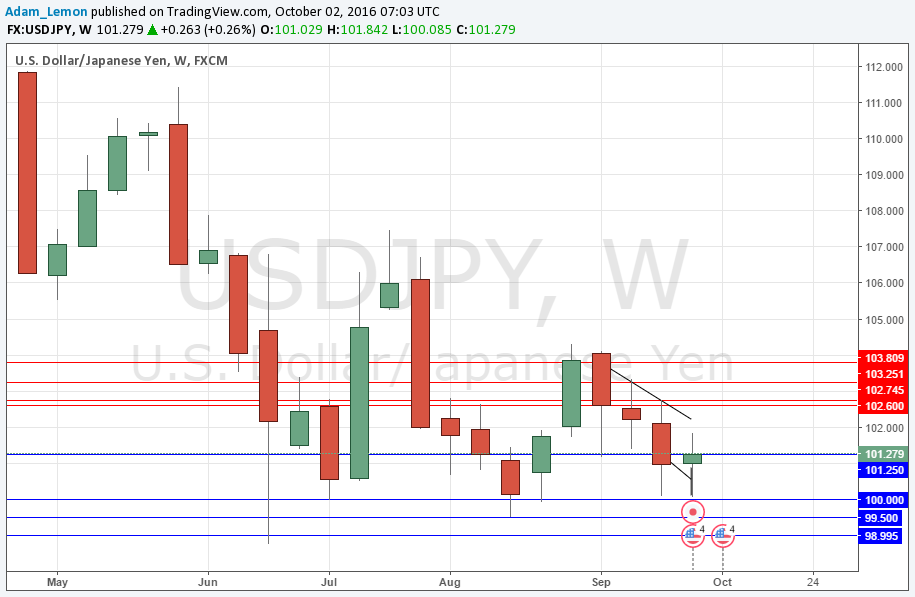
The chart below shows something interesting: there is a long-term bearish trend in force, but the price just cannot stay below the psychologically key 100.00 level. This suggests one of two outcomes: either the price will finally break below 100.00 with force, or it will turn around begin to rise and we will see a long-term trend change. For me, if the price can get established above 102.75, the long-term bearish trend would be over.
Conclusion
Bullish on NZD/USD.


