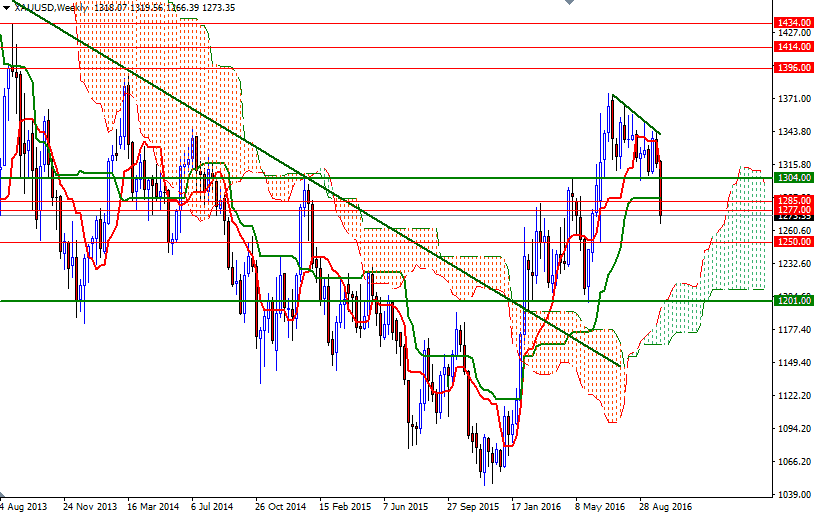
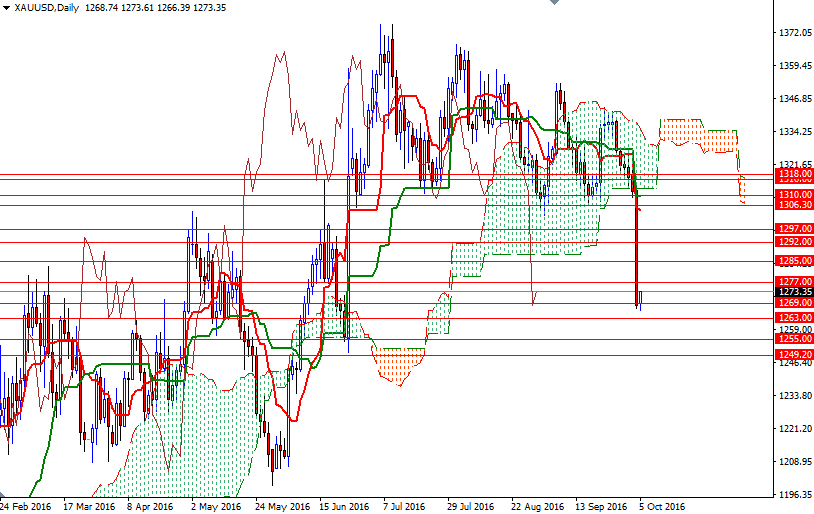
Gold prices ended Tuesday's session down 3.32%, their biggest decline since January 2015, after a breach of the key support level at $1300 triggered a sell-off. The strength in the dollar and a media report discussing possible ECB tapering scenarios also contributed further pressure on the market. The XAU/USD pair slumped to $1266.39 before recovering slightly to the $1273.35 level.
Lately, the precious metal has been struggling due to growing perception the U.S. Federal Reserve is on course to hike interest rates by year-end. Chicago Federal Reserve Bank President Charles Evans said "I have a forecast where things continue to improve. I do think there will be a rate increase". The week offers a big batch of news on the U.S. economy, headlined by the September jobs report. Other highlights include factory orders, non-manufacturing PMI and trade balance.
From a technical point of view, trading below the Ichimoku clouds on the daily and 4-hourly charts suggests that the market is likely to continue to suffer from the bearish short-term outlook. We have negatively aligned Tenkan-Sen (nine-period moving average, red line) and Kijun-Sen (twenty six-period moving average, green line) lines on both charts, and the Chikou-span (closing price plotted 26 periods behind, brown line) is indicative of solid downward momentum. With these in mind, I think the market will have a tendency to test the 1250 area, unless prices climb and manage to hold above the Ichimoku cloud on the H4 chart. To the upside, keep an eye on the 1279/7 zone. The bulls will have to overcome this hurdle in order to sail towards the 1287.40-1285 region. Beyond that, there are critical barriers such as 1292 and 1297. If the bulls run out of steam and prices reverse, we will probably visit 1269 and 1263. A break below 1263 would set XAU/USD up for a test of the 1257/5 area.


