Gold prices inched higher on Wednesday after the release of minutes from the U.S. Federal Reserve’s September meeting highlighted internal divisions over timing of next interest rate hike. "Some participants believed that it would be appropriate to raise the target range for the federal funds rate relatively soon if the labor market continued to improve and economic activity strengthened, while some others preferred to wait for more convincing evidence that inflation was moving toward the Committee’s 2 percent objective," the Fed said in the minutes. Traders put the odds of a U.S. rate increase in December at about 70%. I think the market has priced in much of these expectations and as a result, how tightening is conducted beyond that will be more important.
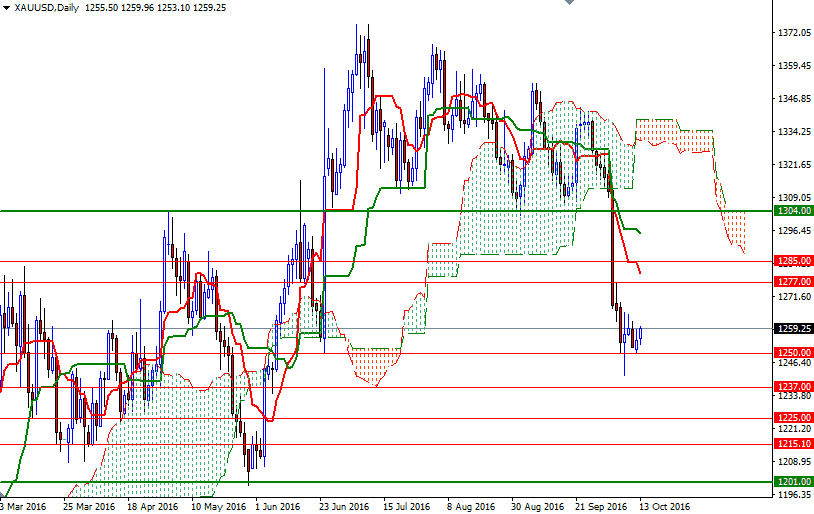
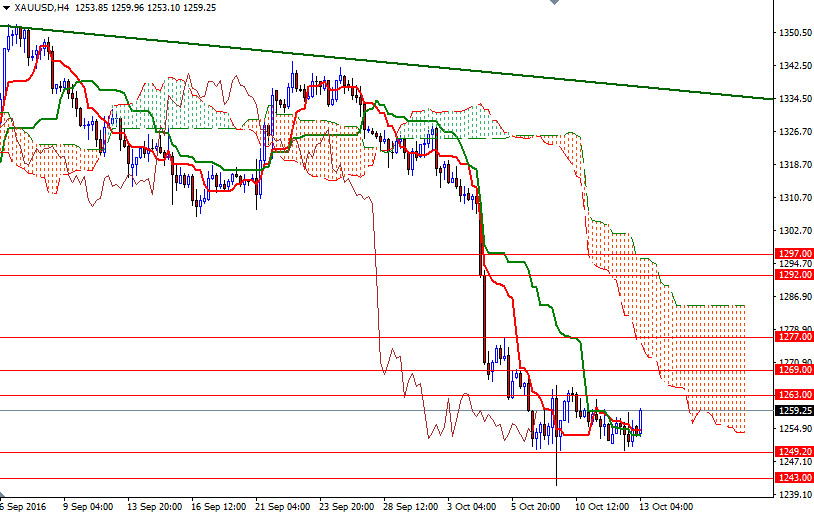
From a technical point of view, trading below the Ichimoku clouds on the daily and 4-hour time frames suggests that the downside risks remain. The daily Chikou-span (closing price plotted 26 periods behind, brown line), which resides below the cloud and negatively aligned Tenkan-Sen (nine-period moving average, red line) and Kijun-Sen (twenty six-period moving average, green line) lines also weaken the technical outlook. However, as I mentioned in my weekly analysis, the key support at around 1250 (the 38.2 retracement of the bullish run from $1046.33 to $1375.10) will play an important role in the near-term.
With these in mind, it would not be surprising if we have made some kind of temporary floor and move towards 1277 before heading back to the weekly cloud. To the upside, the initial resistance stands at 1263. If XAU/USD convincingly breaks through 1263, we could see a continuation to 1270/69. The Ichimoku clouds on the H4 chart occupy the area between 1269 and 1285. That means the bulls have to deal with a significant amount of pressure in order to take control back. On the other hand, if the bears increase the downward pressure and drag the market below 1250-1249.20, we might proceed to the 1243/0 zone. Falling through 1240 could encourage sellers and increase the possibility of an attempt to visit the 1229.50 zone.


